Fig. 8.
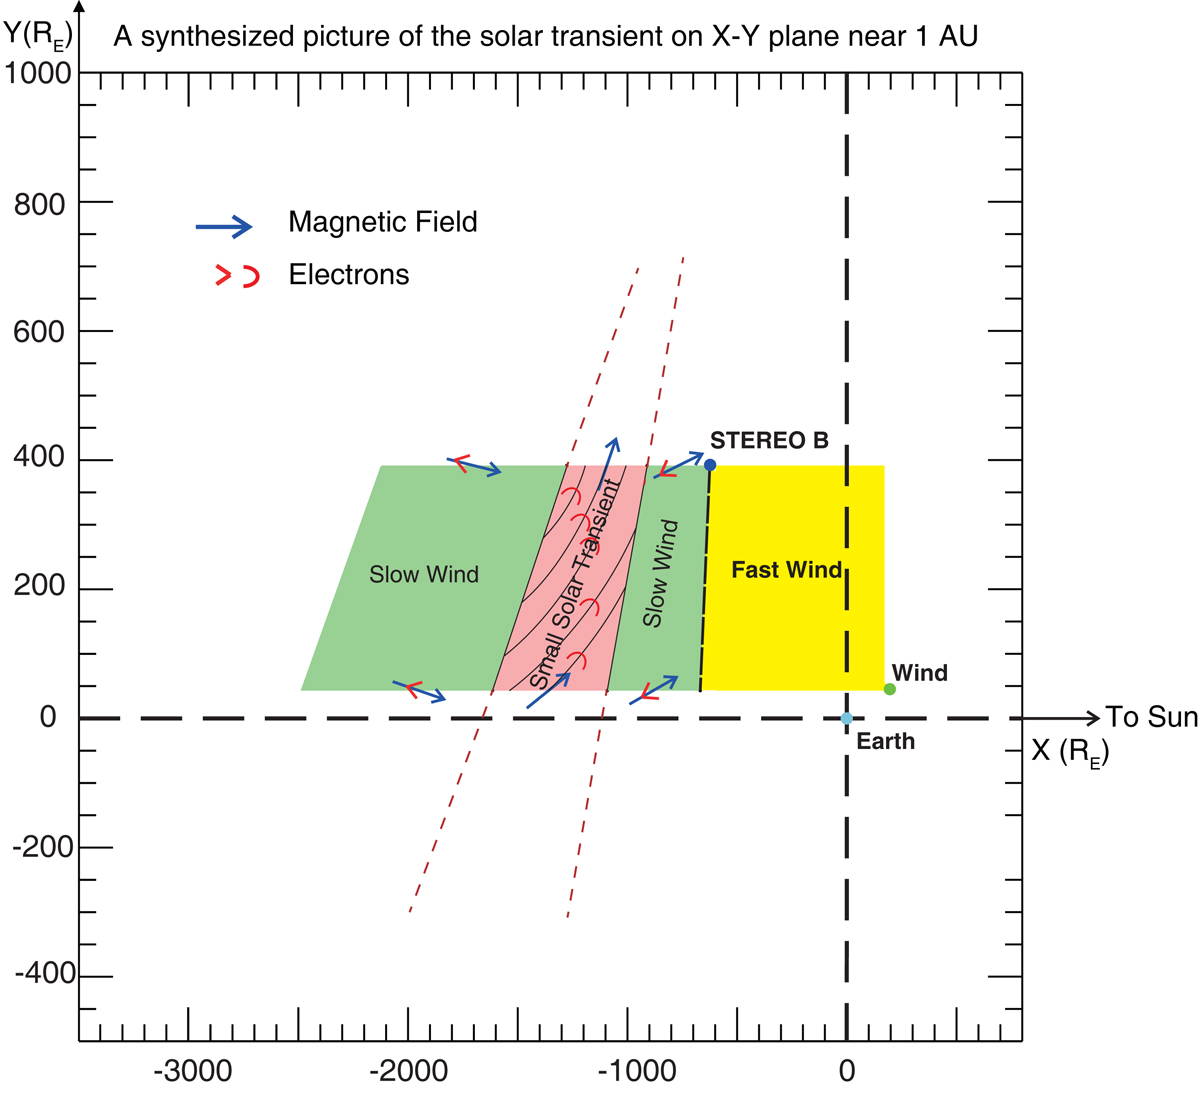
Synthesized picture of the solar transient near 1 AU. The low density area is shown in pink. The surrounding slow wind is in green, while the fast wind is in yellow. The blue arrows represent the directions of magnetic field, the red arrows and red half circles represent the suprathermal electron flows. Semicircles are used for the region where the suprathermal electrons are scattered to a half-sphere distribution. Black lines within the pink region represent the mapping of field lines.
Current usage metrics show cumulative count of Article Views (full-text article views including HTML views, PDF and ePub downloads, according to the available data) and Abstracts Views on Vision4Press platform.
Data correspond to usage on the plateform after 2015. The current usage metrics is available 48-96 hours after online publication and is updated daily on week days.
Initial download of the metrics may take a while.