Free Access
Fig. 3.
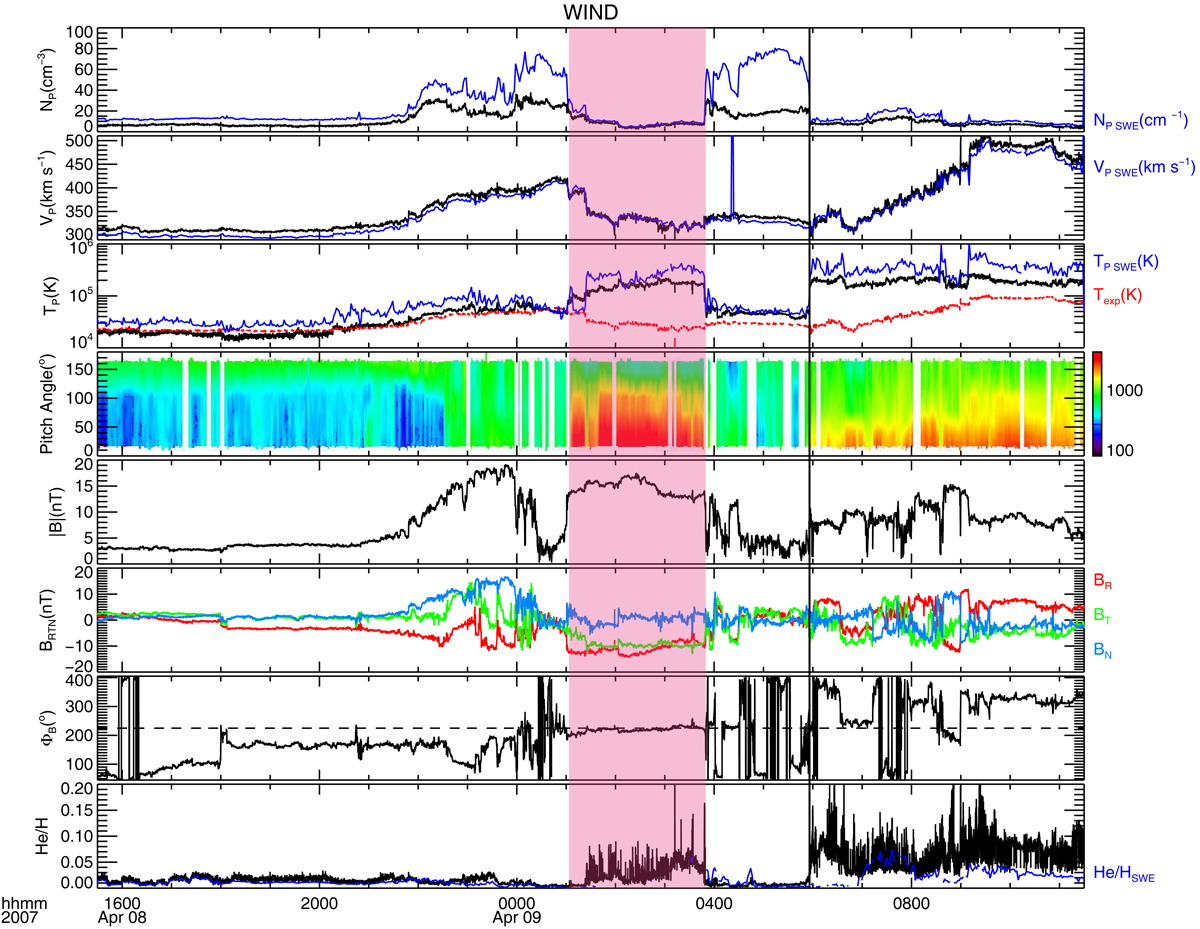
In situ plasma and magnetic field observations by Wind in the same format as Fig. 2. For panels 1, 2, 3, and 8 the black lines are the data from 3DP, while the blue lines are from SWE.
Current usage metrics show cumulative count of Article Views (full-text article views including HTML views, PDF and ePub downloads, according to the available data) and Abstracts Views on Vision4Press platform.
Data correspond to usage on the plateform after 2015. The current usage metrics is available 48-96 hours after online publication and is updated daily on week days.
Initial download of the metrics may take a while.