Fig. 10.
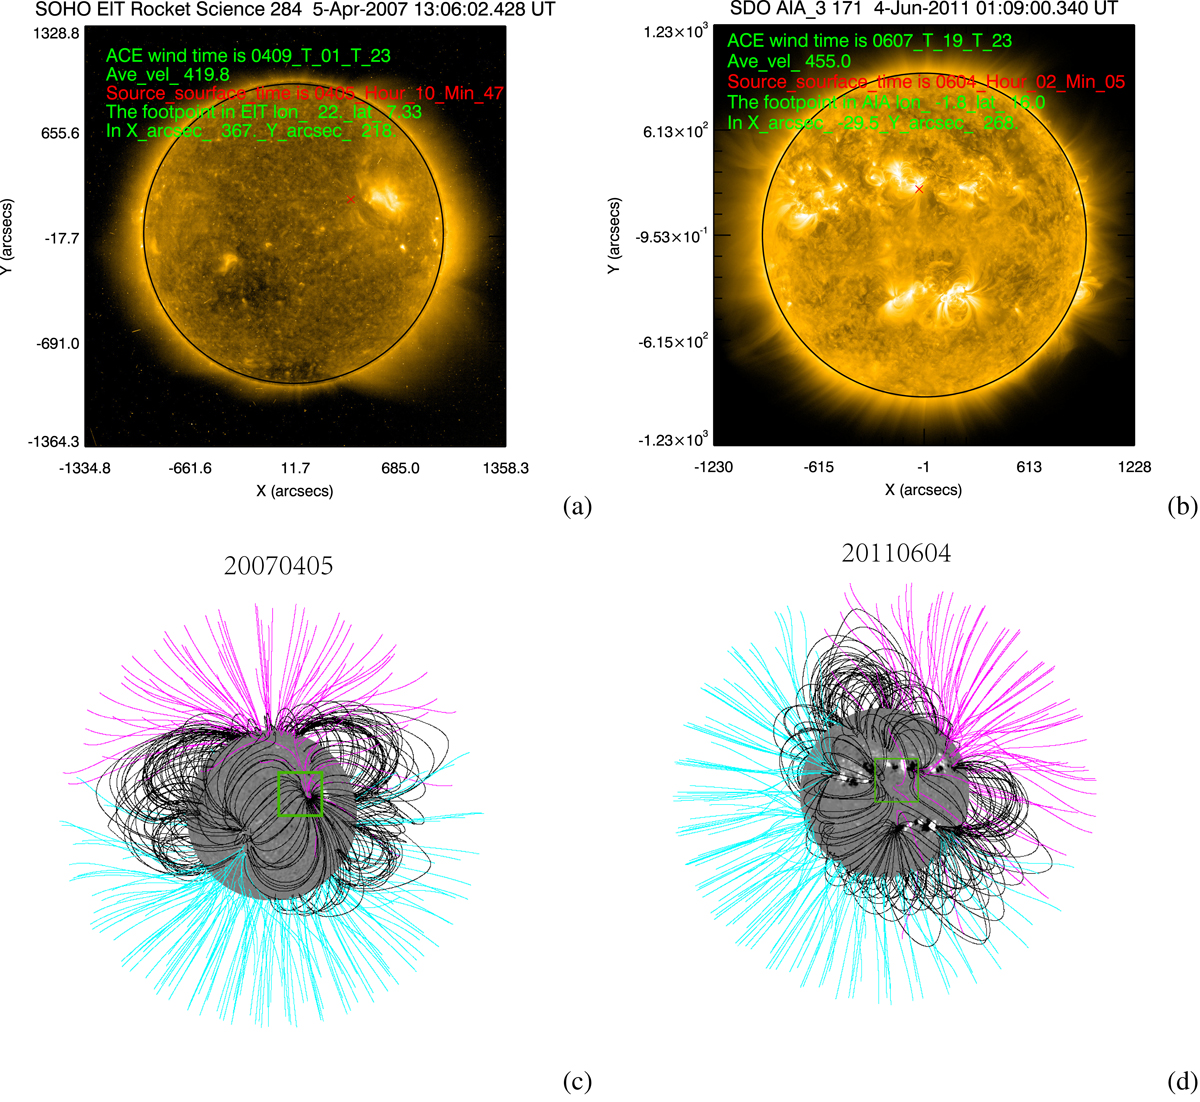
(a) Footpoint of event One observed by ACE traced back on the spectroscopic image taken by EIT 284 Å, SOHO; (b) Footpoint of event Two observed by ACE traced back on the spectroscopic image taken by AIA 171 Å, SDO; (c) PFSS investigation of CR 2055; (d) PFSS investigation of CR 2110. In c and d, the open field lines are in cyan (magenta) when negative (positive); the closed field lines are in black. The green square is the PFSS region focused on.
Current usage metrics show cumulative count of Article Views (full-text article views including HTML views, PDF and ePub downloads, according to the available data) and Abstracts Views on Vision4Press platform.
Data correspond to usage on the plateform after 2015. The current usage metrics is available 48-96 hours after online publication and is updated daily on week days.
Initial download of the metrics may take a while.