Fig. 5.
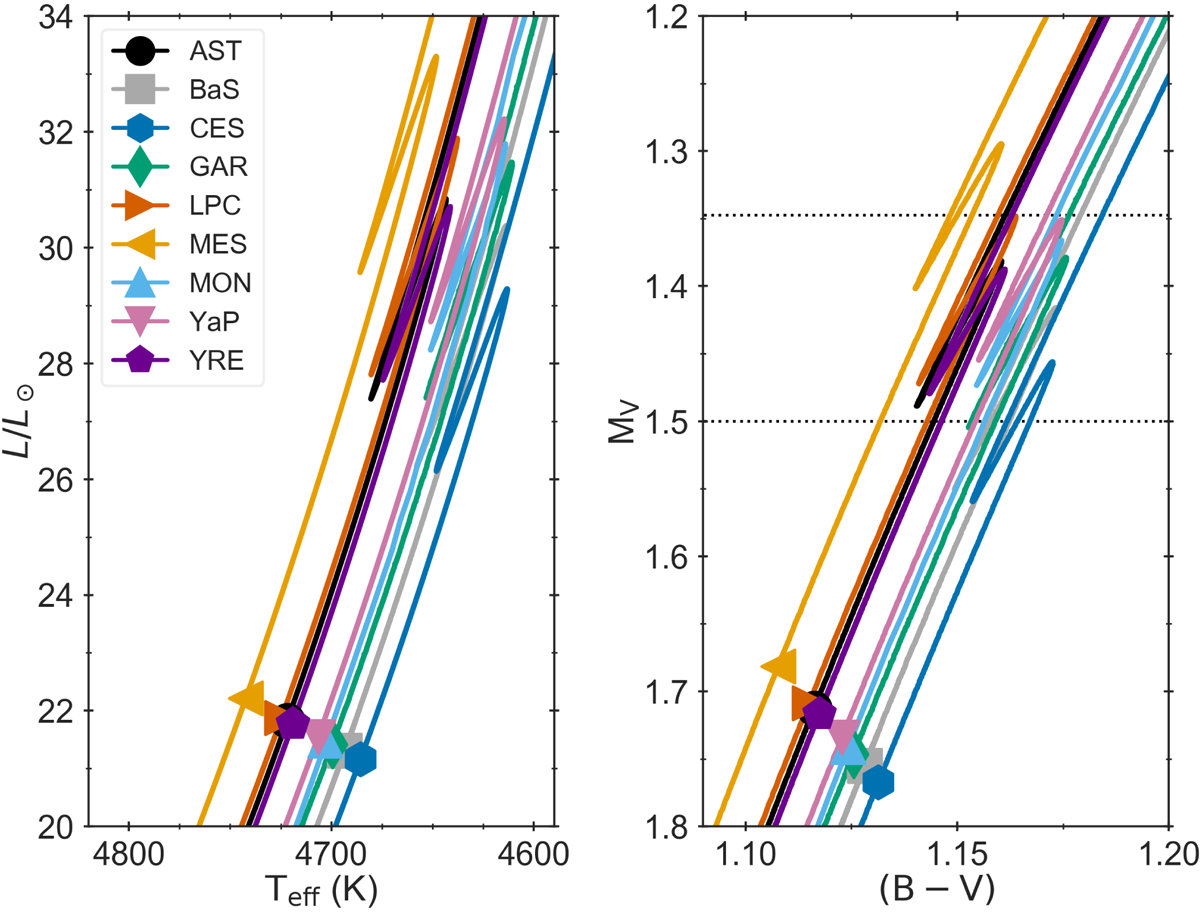
Left: HRD depicting the 1 M⊙ solar-radius calibrated tracks and the position of models at 7 R⊙. Right: optical band colour–magnitude diagram of the 1 M⊙ solar-radius calibrated tracks and corresponding models at 7 R⊙. Horizontal dashed lines mark the position of the brightest and faintest predicted bump absolute magnitudes across the codes to guide the eye.
Current usage metrics show cumulative count of Article Views (full-text article views including HTML views, PDF and ePub downloads, according to the available data) and Abstracts Views on Vision4Press platform.
Data correspond to usage on the plateform after 2015. The current usage metrics is available 48-96 hours after online publication and is updated daily on week days.
Initial download of the metrics may take a while.