Fig. 3.
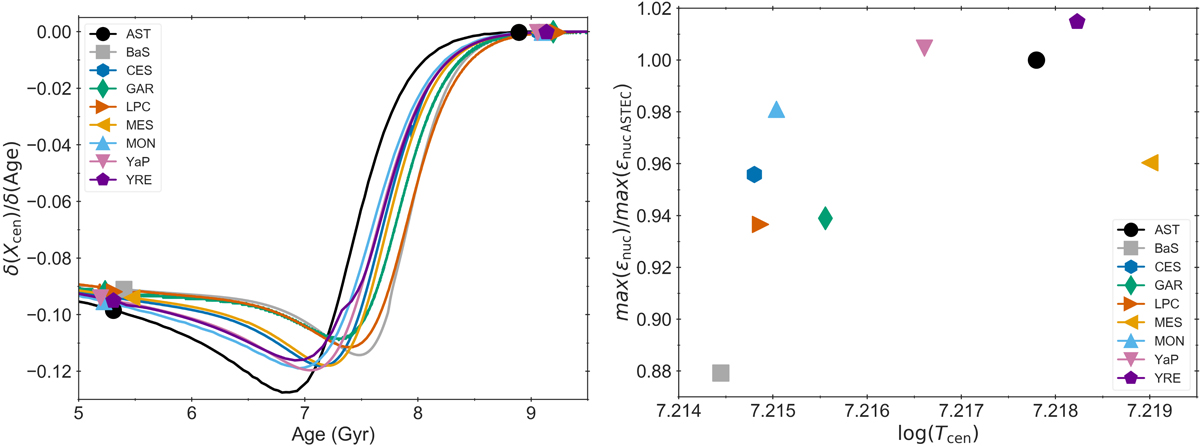
Left: time derivative of the central hydrogen content Xcen as a function of age for the 1 M⊙ solar-radius calibrated tracks. Symbols depict the location of models at 1 R⊙ and at the end of the main-sequence phase. Right: ratio of the maximum nuclear energy generation rate for each code relative to the ASTEC value as a function of the central temperature for the 1 M⊙ at 1 R⊙ solar-radius calibrated models.
Current usage metrics show cumulative count of Article Views (full-text article views including HTML views, PDF and ePub downloads, according to the available data) and Abstracts Views on Vision4Press platform.
Data correspond to usage on the plateform after 2015. The current usage metrics is available 48-96 hours after online publication and is updated daily on week days.
Initial download of the metrics may take a while.