Fig. 9
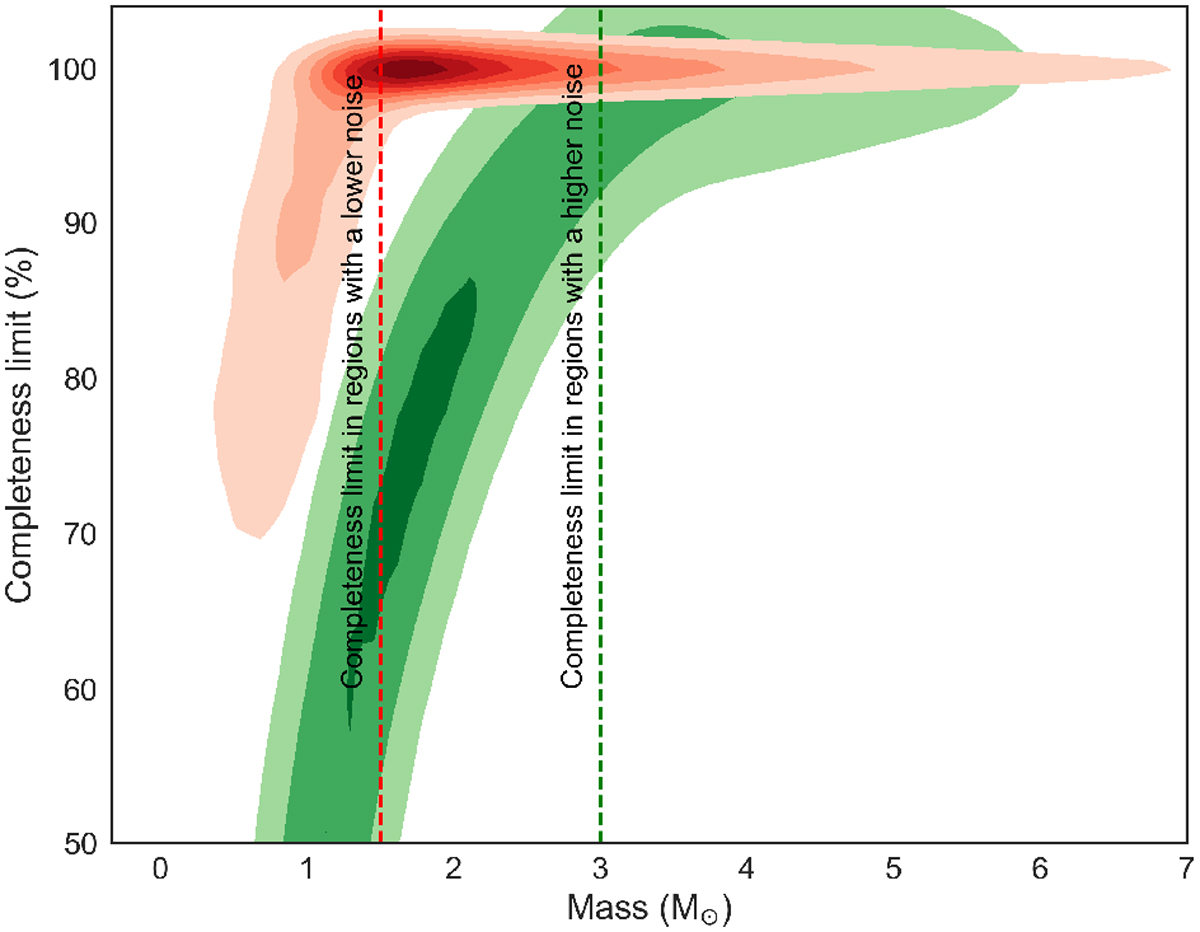
Completeness level of the ALMA continuum map at 3 mm as a function of mass. The KDE shown in red indicates the detection probability of the cores in the noise-free regions. The KDE illustrated in green represents the detection probability for the cores located at the vicinity of bright sources. A completeness level of 90% is obtained for cores with masses > 1.5 M⊙ and > 3 M⊙ for the regions with a lower noise (0.3 mJy beam−1) and a higher noise (0.9 mJy beam−1) respectively.These completeness limits are marked with vertical dashed and dotted lines for the noise-free and noisy regions, respectively.
Current usage metrics show cumulative count of Article Views (full-text article views including HTML views, PDF and ePub downloads, according to the available data) and Abstracts Views on Vision4Press platform.
Data correspond to usage on the plateform after 2015. The current usage metrics is available 48-96 hours after online publication and is updated daily on week days.
Initial download of the metrics may take a while.