Fig. 6
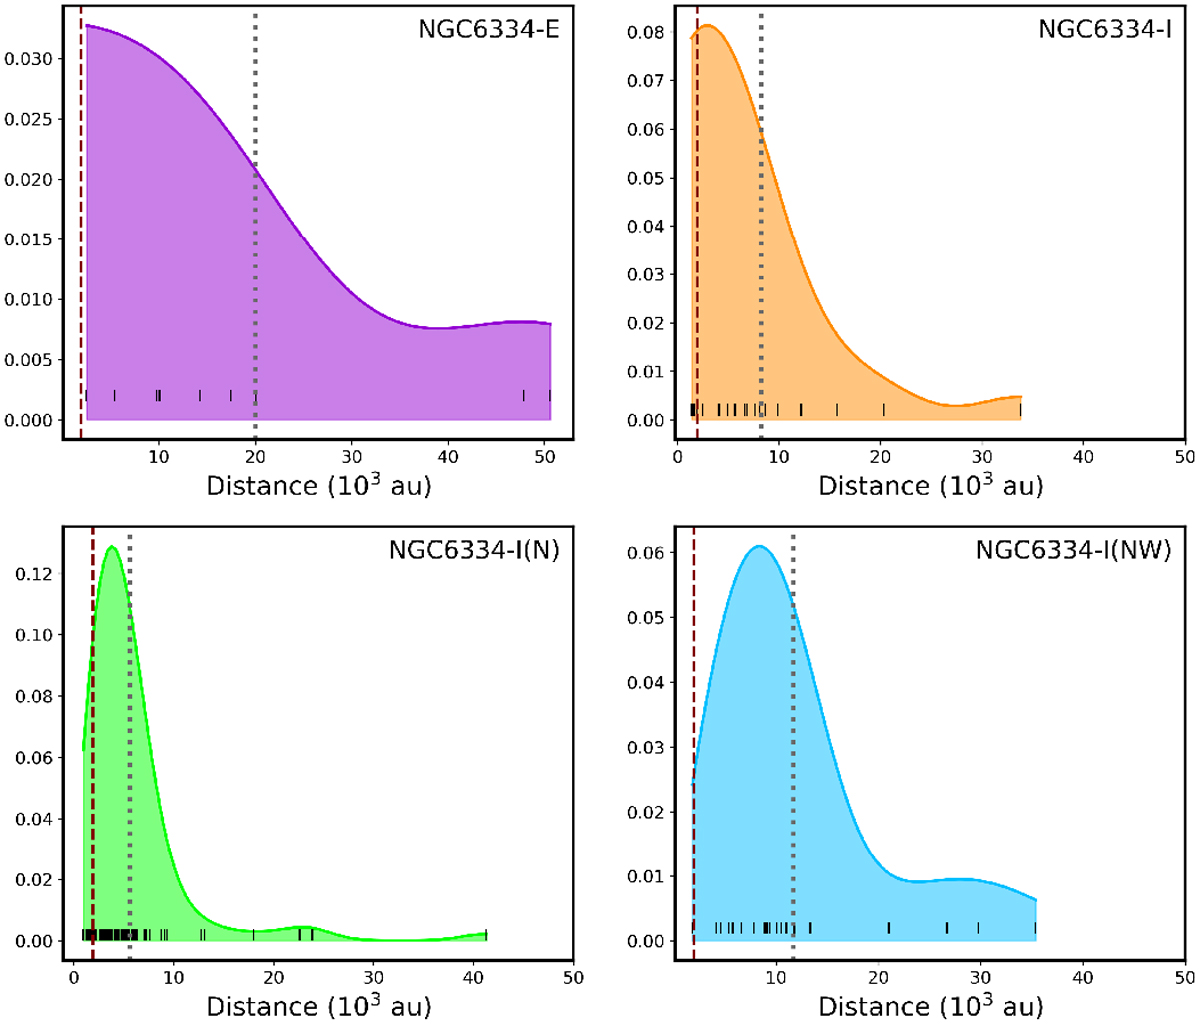
KDE of the projected separation between nearest neighbours for NGC 6334-E, NGC 6334-I, NGC 6334-I(N) and NGC 6334-I(NW). In each panel, the red vertical dashed line shows the 1 300 au resolution limit of the ALMA observations, while the vertical grey dotted line denotes the median distance between the cores in the cluster. The short vertical lines at the bottom of each panel indicate the observed separations between members of each cluster.
Current usage metrics show cumulative count of Article Views (full-text article views including HTML views, PDF and ePub downloads, according to the available data) and Abstracts Views on Vision4Press platform.
Data correspond to usage on the plateform after 2015. The current usage metrics is available 48-96 hours after online publication and is updated daily on week days.
Initial download of the metrics may take a while.