Fig. 5
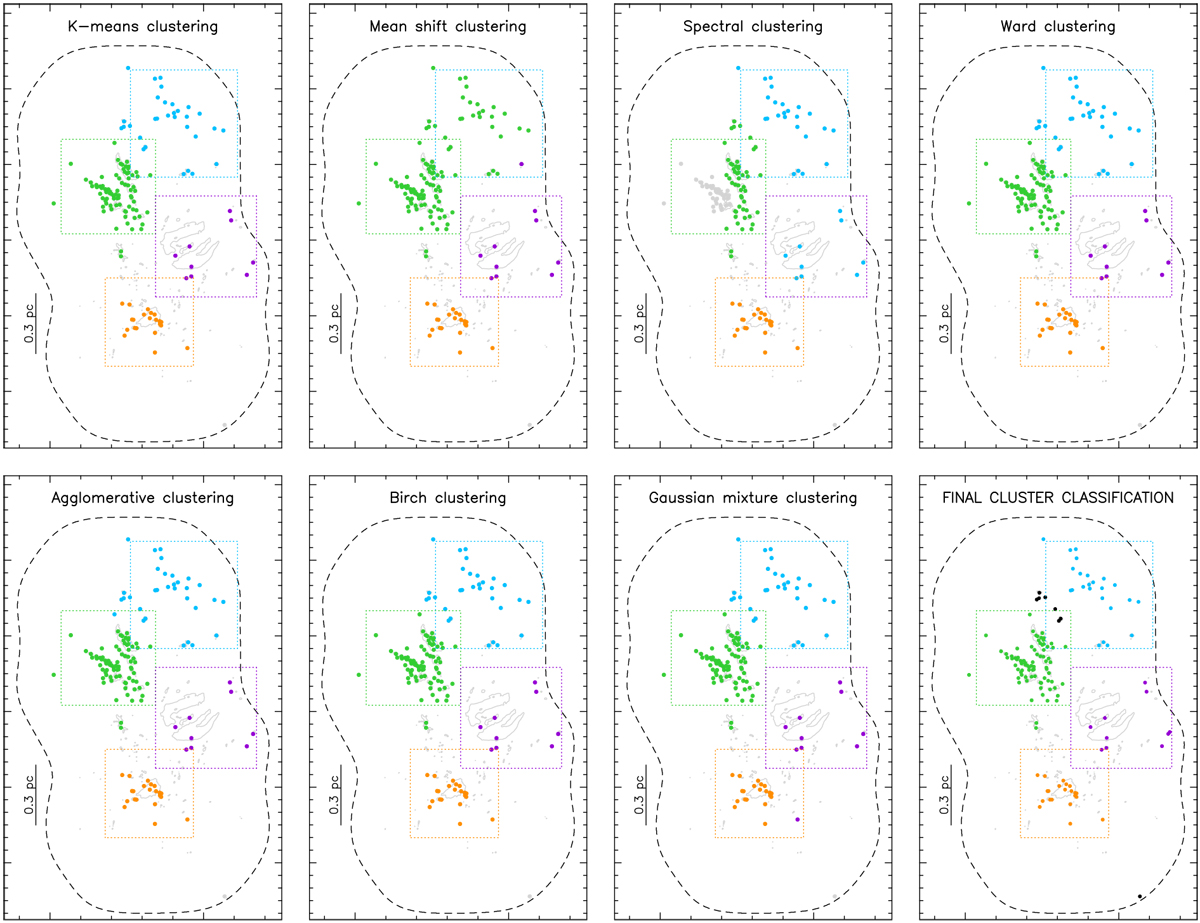
Each panel shows area of NGC 6334 observed with ALMA (see Fig. 1) and coloured circles correspond to the ALMA continuum sources detected in region (see Table A.1). Each panel correspond to one of theseven clustering algorithms used to identify clusters in the region (see Sect. 4.1). The colours of the circles depict the different clusters to which each continuum source belongs according to each algorithm. The last panel showsthe final association of each source with one of the four clusters: light blue for NGC 6334-I(NW), lime for NGC 6334-I(N), violet for NGC 6334-E and orange for NGC 6334-I. The black circles in the last panel correspond to the sources not assigned to any cluster. In all panels, the rectangles mark the position of the relevant regions also marked in Fig. 1.
Current usage metrics show cumulative count of Article Views (full-text article views including HTML views, PDF and ePub downloads, according to the available data) and Abstracts Views on Vision4Press platform.
Data correspond to usage on the plateform after 2015. The current usage metrics is available 48-96 hours after online publication and is updated daily on week days.
Initial download of the metrics may take a while.