Fig. 4
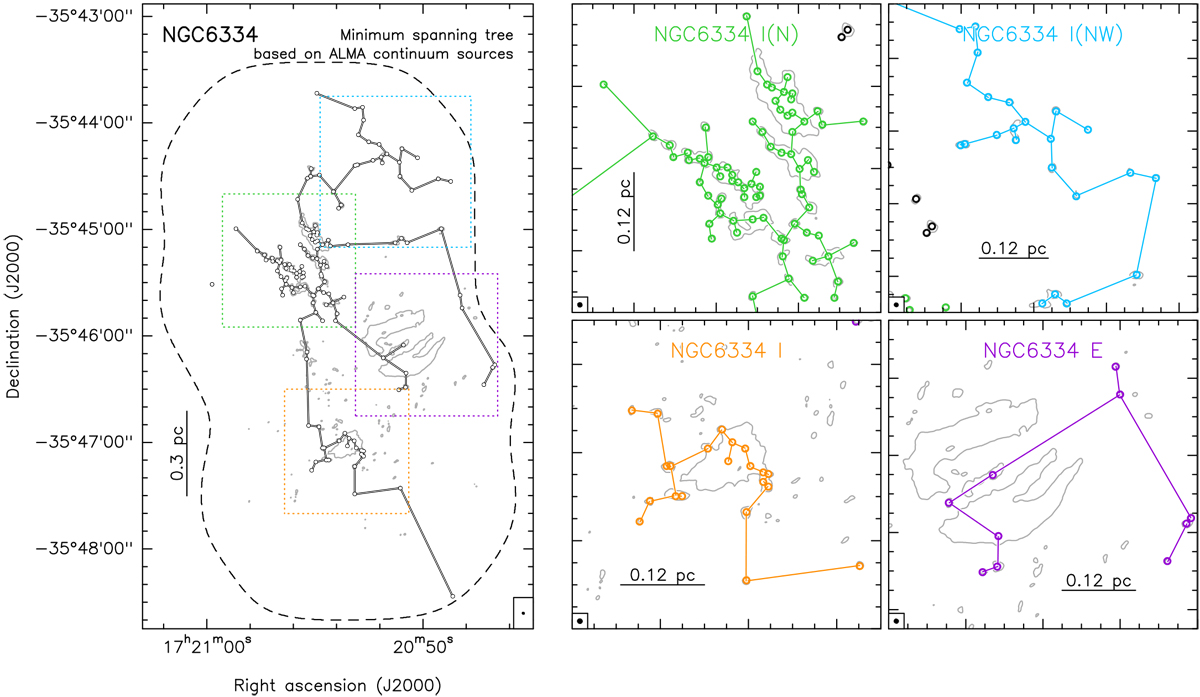
Left: minimum spanning tree (MST) for the ALMA continuum sources. The positions of the dense cores are indicated with circles, while the lines denote the tree. The rectangles mark the positions of the relevant regions also marked in Fig. 1. Right: minimum spanning tree for each of the four clusters identified in NGC 6334. The MSTs for each region/cluster are built considering only those members that belong to each cluster (see Table A.1). The ALMA continuum emission at 87.6 GHz is shown in grey contours. The contour level corresponds to 0.5 Jy beam−1.
Current usage metrics show cumulative count of Article Views (full-text article views including HTML views, PDF and ePub downloads, according to the available data) and Abstracts Views on Vision4Press platform.
Data correspond to usage on the plateform after 2015. The current usage metrics is available 48-96 hours after online publication and is updated daily on week days.
Initial download of the metrics may take a while.