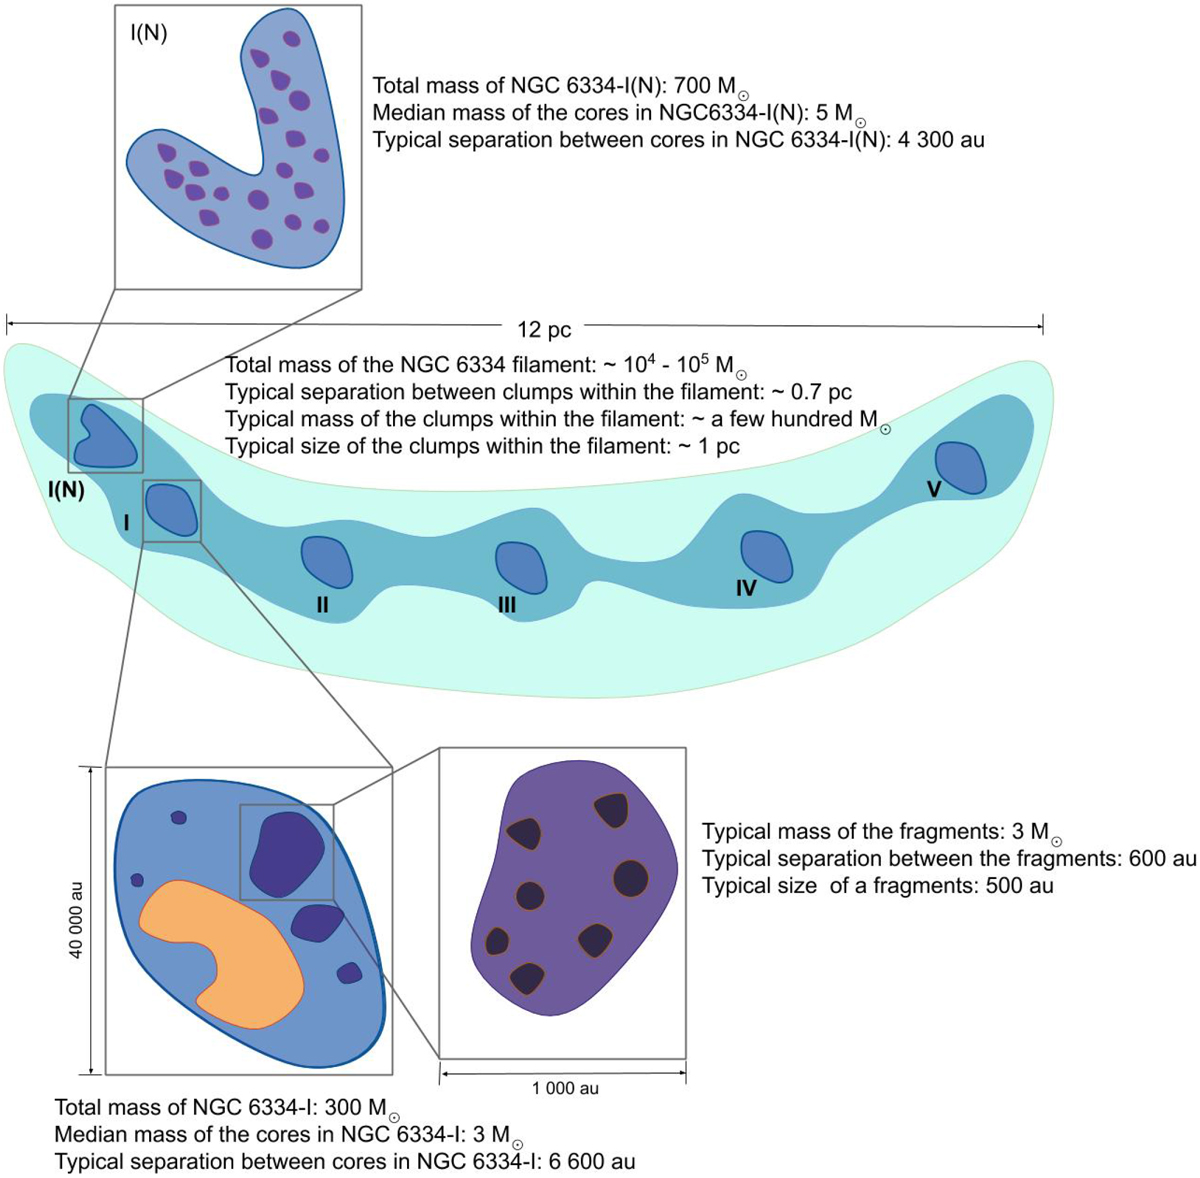
Fig. 15

Schematic view of the central part of the NGC 6334 filamentary cloud. The distribution is based on Herschel observationsby Russeil et al. (2013). The horizontal and vertical orientations correspond to the Galactic longitude and latitude coordinates. The sketch displays the hierarchical fragmentation seen in the cloud from the scale of the filament down to thescale of individual dense cores and protostars. The colours are scaled based on the density (from light blue to black). Inthis colour scheme, the lighter colours (e.g. blue) correspond to the lower densities, while the darker colours (e.g. violet and black) represent the dense regions. The ionised gas is shown with orange. The values of masses and sizes are based onthe observations presented in this work and from the literature (Brogan et al. 2016; Hunter et al. 2014).
Current usage metrics show cumulative count of Article Views (full-text article views including HTML views, PDF and ePub downloads, according to the available data) and Abstracts Views on Vision4Press platform.
Data correspond to usage on the plateform after 2015. The current usage metrics is available 48-96 hours after online publication and is updated daily on week days.
Initial download of the metrics may take a while.


