Fig. 13
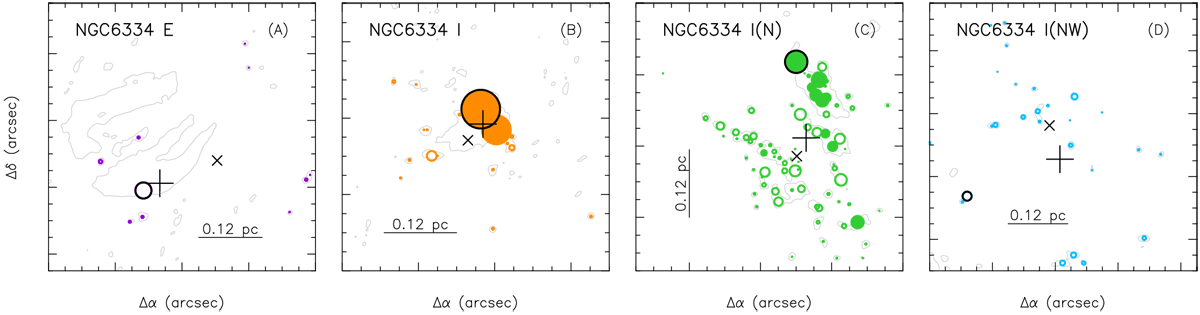
Distribution of the cluster members relative to the centre mass marked with a plus sign, and relative to the geometrical centre marked with a cross. The segregated cores defined based on the mass-segregation ratio (see Fig. 12) are shown with filled circles. The black circle shows the position of the most massive member in each cluster.The size of the circles correspond to the mass of the cores.
Current usage metrics show cumulative count of Article Views (full-text article views including HTML views, PDF and ePub downloads, according to the available data) and Abstracts Views on Vision4Press platform.
Data correspond to usage on the plateform after 2015. The current usage metrics is available 48-96 hours after online publication and is updated daily on week days.
Initial download of the metrics may take a while.