Fig. 11
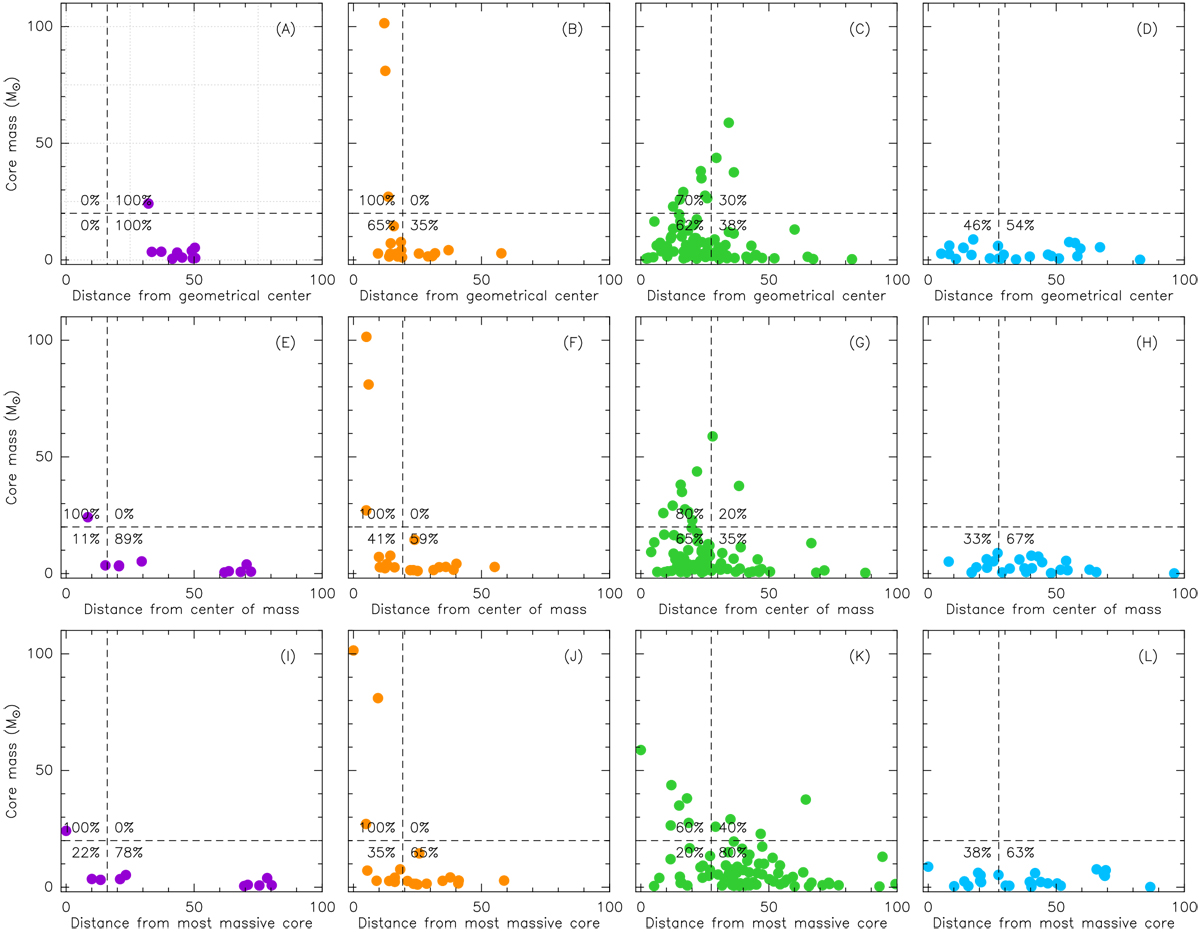
Mass of each core against its distance from the geometrical centre of the cluster (top panels), the centre of mass (middle panels), and the most massive core of each cluster (bottom panels). Each column corresponds to a cluster: NGC 6334-E (first column, in violet), NGC 6334-I (second column, in orange), NGC 6334-I(N) (third column, in green), and NGC 6334-I(NW) (fourth column, in light blue). The vertical and horizontal dashed lines divide each panel in four quadrants with a mass threshold of 20 M⊙ and a distance threshold corresponding to one third of the cluster radius. The numbers indicate the percentage of sources (above and below the mass threshold) that are located in the inner or outer part of the cluster.
Current usage metrics show cumulative count of Article Views (full-text article views including HTML views, PDF and ePub downloads, according to the available data) and Abstracts Views on Vision4Press platform.
Data correspond to usage on the plateform after 2015. The current usage metrics is available 48-96 hours after online publication and is updated daily on week days.
Initial download of the metrics may take a while.