Fig. 1
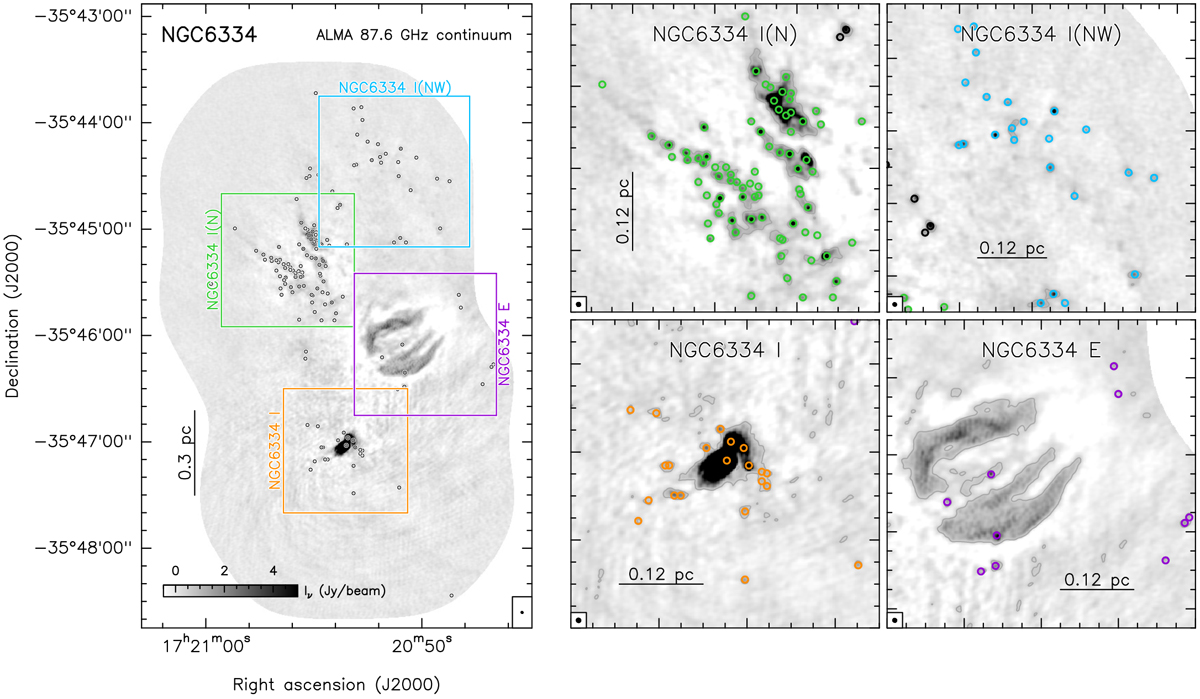
Left: ALMA 87.6 GHz continuum emission map of NGC 6334. The coloured rectangles mark relevant regions studied in more detail throughout the paper. Their names, from north to south, are NGC 6334-I(NW), NGC 6334-I(N), NGC 6334-E and NGC 6334-I. Right: close-up views of four selected regions. In all panels, the circles denote the position of the compact sources identified using SExtractor (see Sect. 3.1, and Table A.1). The colour of the circles in the right panels indicates the association of each source with a cluster (see Sect. 4.1). The synthesised beam of 1′′ is shown in the bottom left or right corners of each panel.
Current usage metrics show cumulative count of Article Views (full-text article views including HTML views, PDF and ePub downloads, according to the available data) and Abstracts Views on Vision4Press platform.
Data correspond to usage on the plateform after 2015. The current usage metrics is available 48-96 hours after online publication and is updated daily on week days.
Initial download of the metrics may take a while.