Fig. 9.
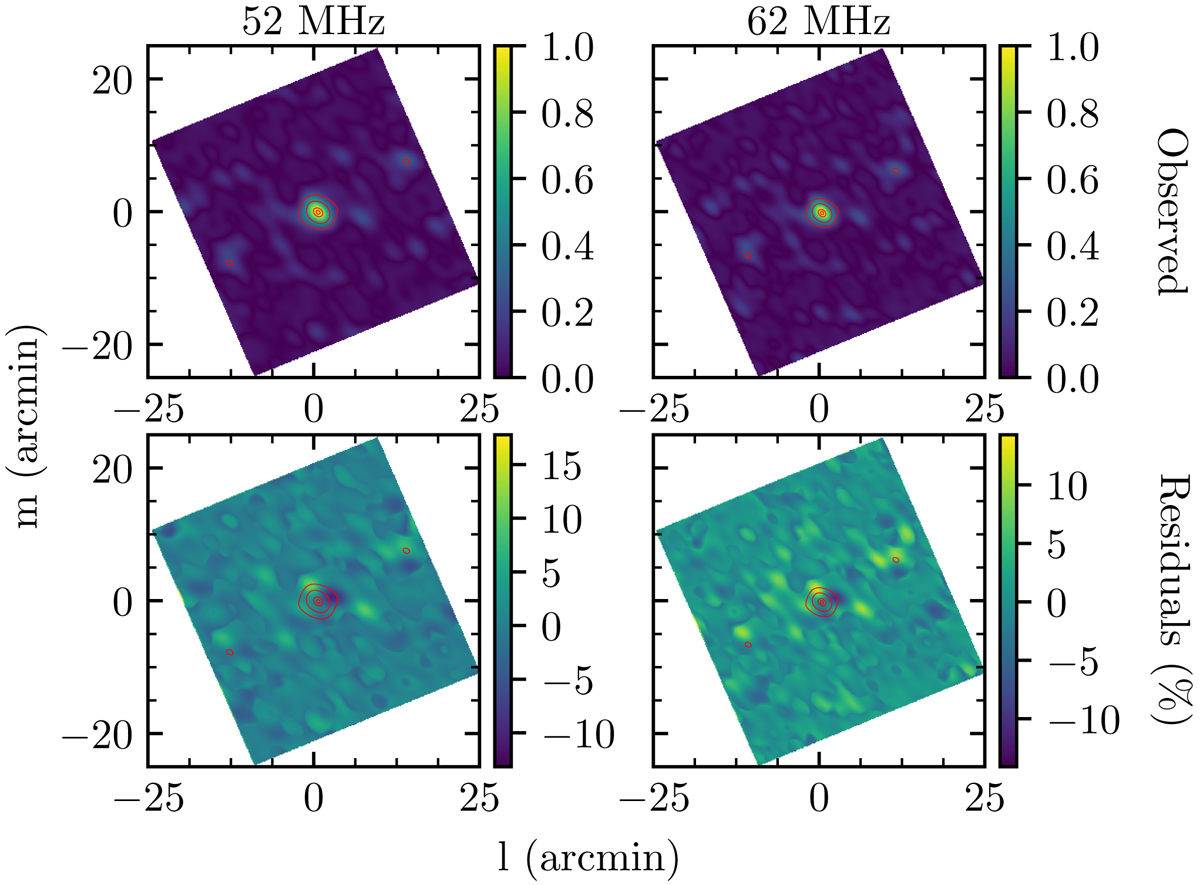
Observed beam for the LBA. The top row shows the observed beam after updating the instrumental time delays in the beamformer (colorscale). The red contours show the amplitude of a beam model generated from the position of the stations with no additional time delays. They are at the 20%, 50%, 90% and 98% level with respect to the peak response. The bottom row shows the residuals after subtracting the beam model from the observed beam (colorscale). The red contours are the same as in the top row.
Current usage metrics show cumulative count of Article Views (full-text article views including HTML views, PDF and ePub downloads, according to the available data) and Abstracts Views on Vision4Press platform.
Data correspond to usage on the plateform after 2015. The current usage metrics is available 48-96 hours after online publication and is updated daily on week days.
Initial download of the metrics may take a while.