Fig. 1.
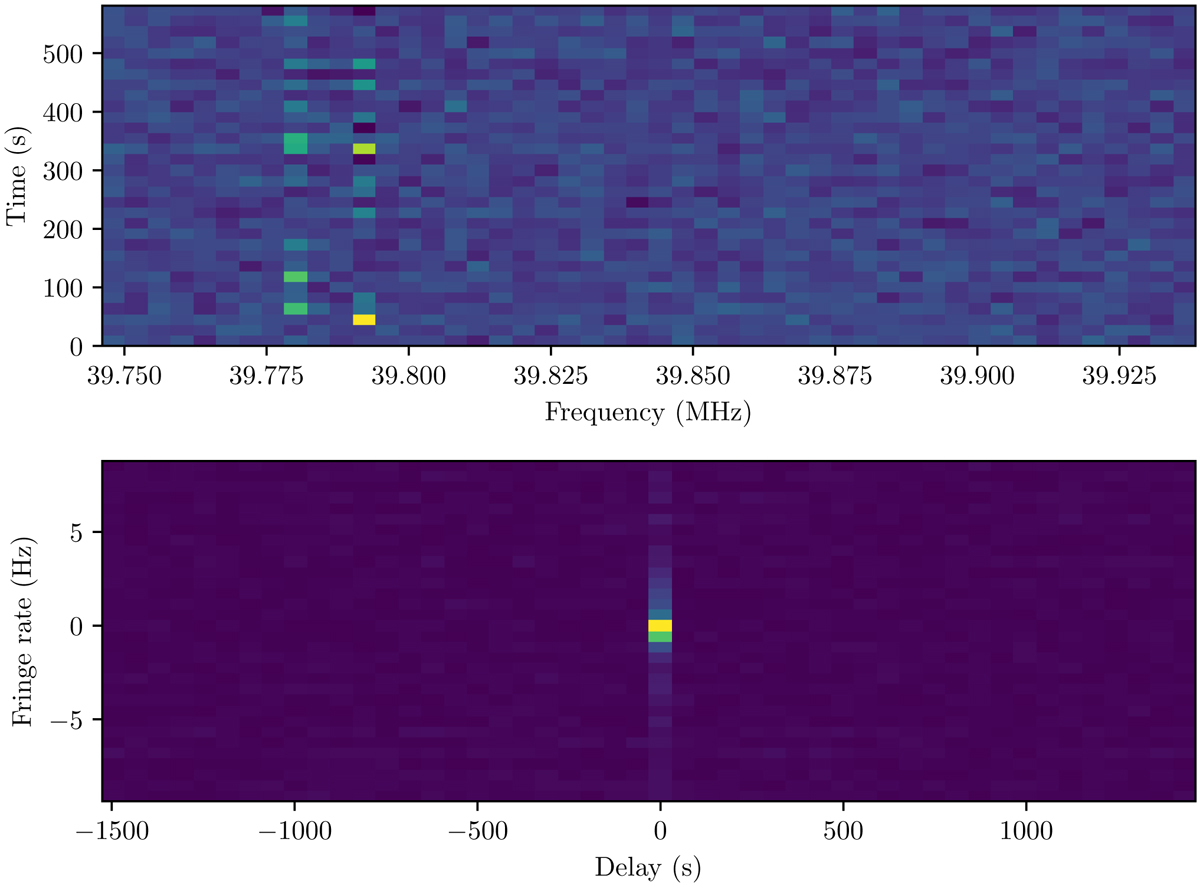
Waterfall plots of the complex visibilities and their Fourier transform. Top panel: amplitude of the visibilities. The RFI can be seen at 39.78 MHz. Bottom panel: Fourier transform of the visibilities. If the visibilities are dominated by a point source in the array tracking center, then this should be a delta function centered at 0 delay and 0 fringe rate. In this case there is some time variability in the data, which produces a spread along the fringe rate.
Current usage metrics show cumulative count of Article Views (full-text article views including HTML views, PDF and ePub downloads, according to the available data) and Abstracts Views on Vision4Press platform.
Data correspond to usage on the plateform after 2015. The current usage metrics is available 48-96 hours after online publication and is updated daily on week days.
Initial download of the metrics may take a while.