Fig. 7
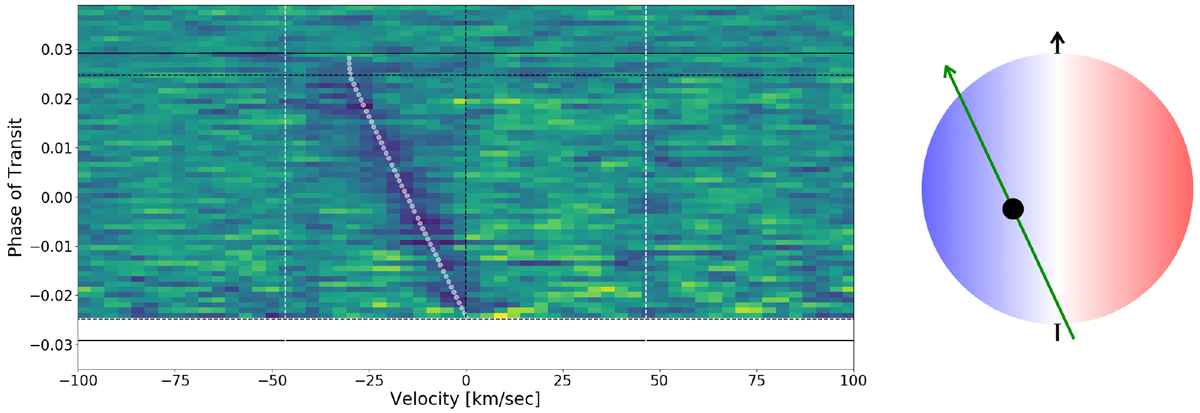
Left: Doppler-shadow measurements on MASCARA-4 b during transit as derived from observations taken with the CHIRON spectrograph on the SMARTS 1.5 m telescope. These consist of 60 mean stellar line profiles from which the average out-of-transit profile is subtracted, showing the movement of the dark planet in front of the fast-rotating star. The black horizontal lines denote t2 and t3 (dashed;the time when the orbiting object starts to ingress and egress) and t1 and t4 (solid; when the orbiting object starts to transit and is no longer transiting) of the transit. Observations started just after t2. The dashed vertical black line represents the systemic velocity of the star, which is set to 0 km s−1. The two vertical white dashed lines indicate the extent of the velocity broadened stellar line profile with a
v sin i* of 46.5 km s−1. The white dotted line represents the best-fit model, corresponding to an impact parameter of
![]() , and |λ| of
, and |λ| of ![]() °.
Right: visualisation of the orientation of the planet orbit with respect to the fast spinning star.
°.
Right: visualisation of the orientation of the planet orbit with respect to the fast spinning star.
Current usage metrics show cumulative count of Article Views (full-text article views including HTML views, PDF and ePub downloads, according to the available data) and Abstracts Views on Vision4Press platform.
Data correspond to usage on the plateform after 2015. The current usage metrics is available 48-96 hours after online publication and is updated daily on week days.
Initial download of the metrics may take a while.