Fig. 2
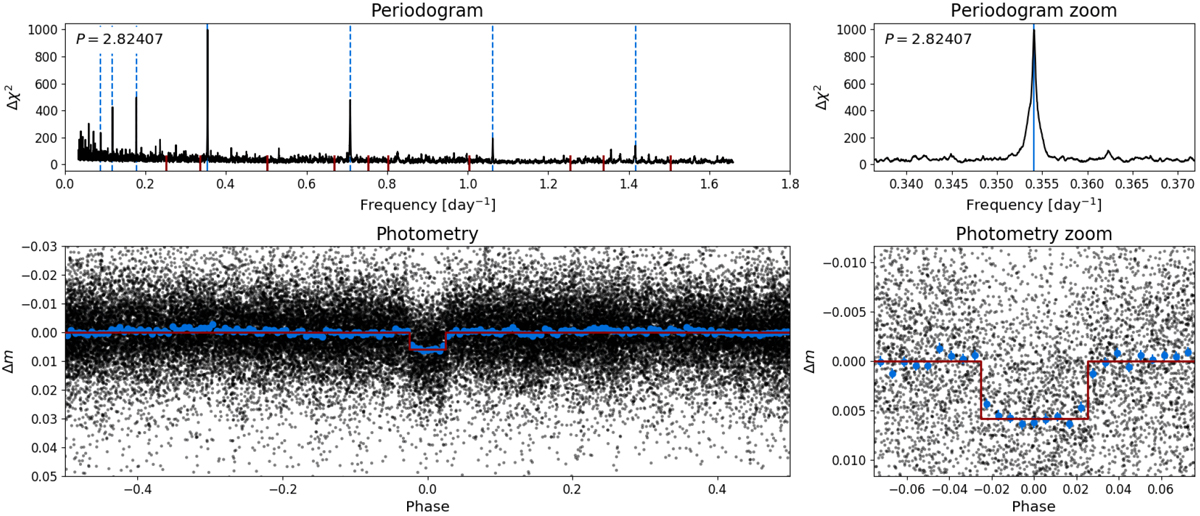
Discovery data of MASCARA-4 b/bRing-1 b. Top left: BLS periodogram of the combined MASCARA and bRing photometry obtained between mid-2017 and the end of 2018. The blue dashed lines represent harmonics of the main periodic signal. Top right: same zoomed-in on the peak in the periodogram, which is located at 0.354 days−1. Bottom left: calibrated MASCARA and bRing data, phase folded to a period of 2.82407 days. The blue dots are binned such that there are nine data points in transit, which comes out to phase steps of ~0.005. The red lineshows the BLS fit on the data. Bottom right: same zoomed-in on the transit event.
Current usage metrics show cumulative count of Article Views (full-text article views including HTML views, PDF and ePub downloads, according to the available data) and Abstracts Views on Vision4Press platform.
Data correspond to usage on the plateform after 2015. The current usage metrics is available 48-96 hours after online publication and is updated daily on week days.
Initial download of the metrics may take a while.