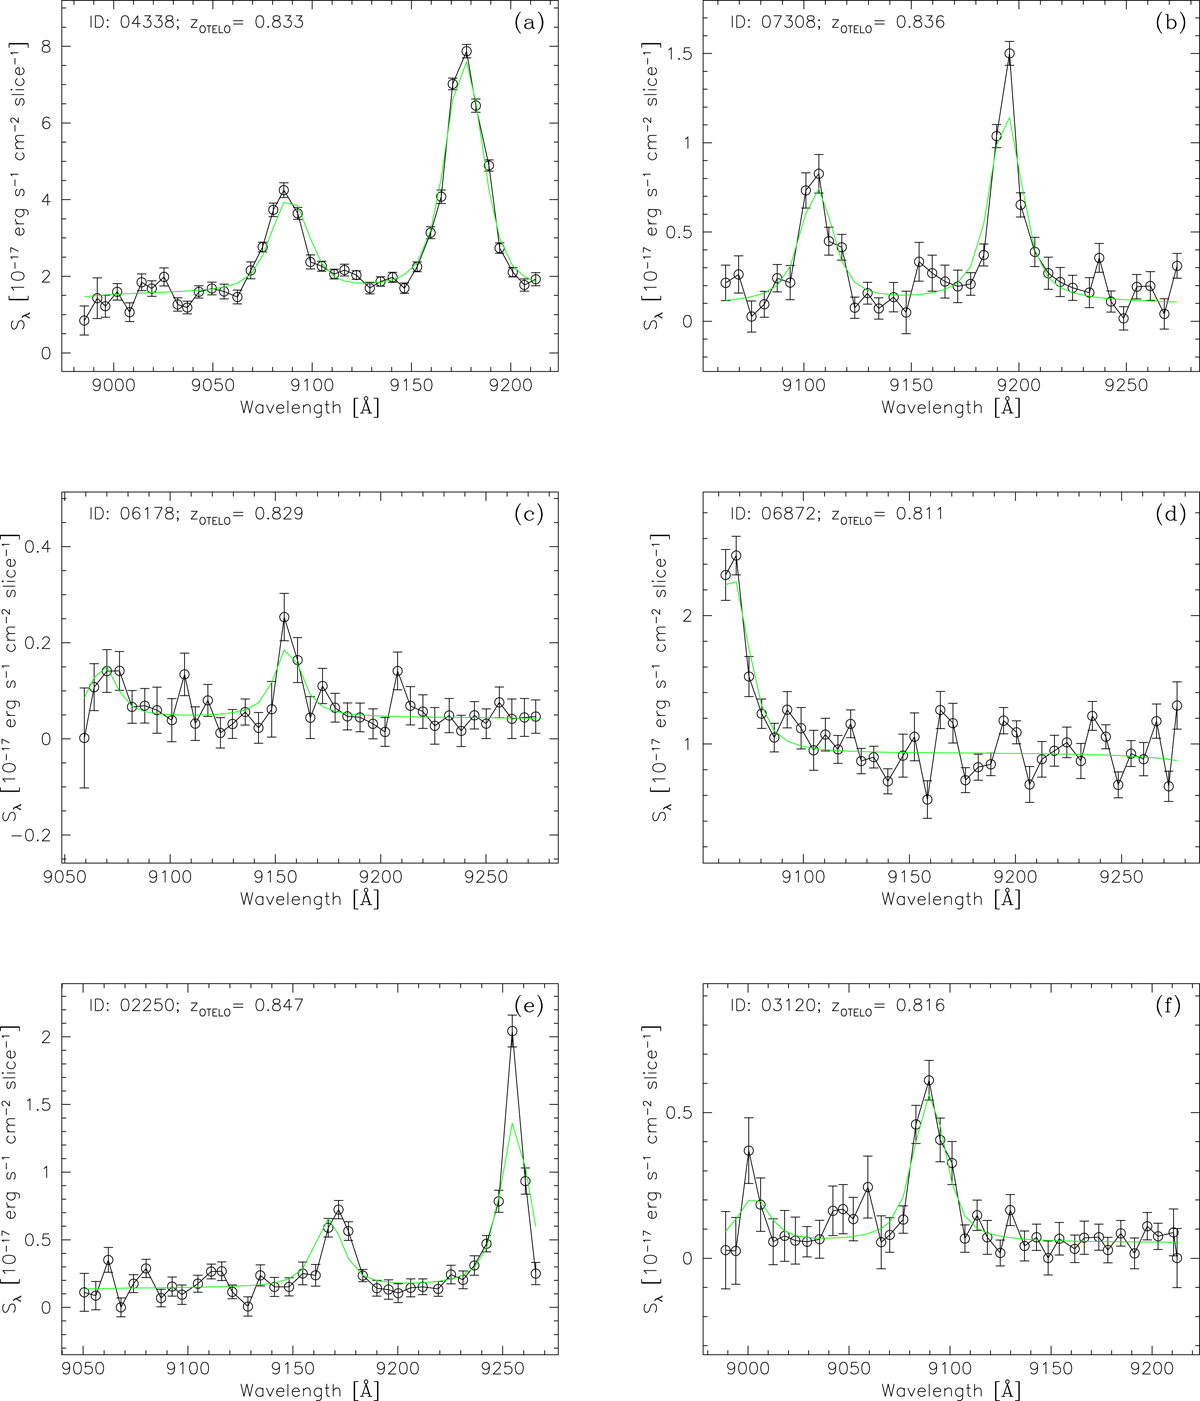
Fig. A.1.

Examples of OTELO pseudo-spectra of [O III] sources (open circles). The best theoretical pseudo-spectrum obtained from the inverse deconvolution process described in Sect. 3.3 is represented by the green line. Panels a–c: pseudo-spectra with a bright (ID: 04338), a faint (ID: 07308), and a very faint (ID: 06178) continuum level, respectively. Panel d: pseudo-spectrum of a source (ID: 06872) with the [O III] λ5007 line truncated on the blue side of the survey spectral range. The pseudo-spectra in panels e and f – ID: 02250 and 03120 – correspond to the [O III] λ4959,5007 sources unseen in ancillary data and only detected by visual examination of the pseudo-spectra (see Sect. 5.3 for details).
Current usage metrics show cumulative count of Article Views (full-text article views including HTML views, PDF and ePub downloads, according to the available data) and Abstracts Views on Vision4Press platform.
Data correspond to usage on the plateform after 2015. The current usage metrics is available 48-96 hours after online publication and is updated daily on week days.
Initial download of the metrics may take a while.


