Fig. 5.
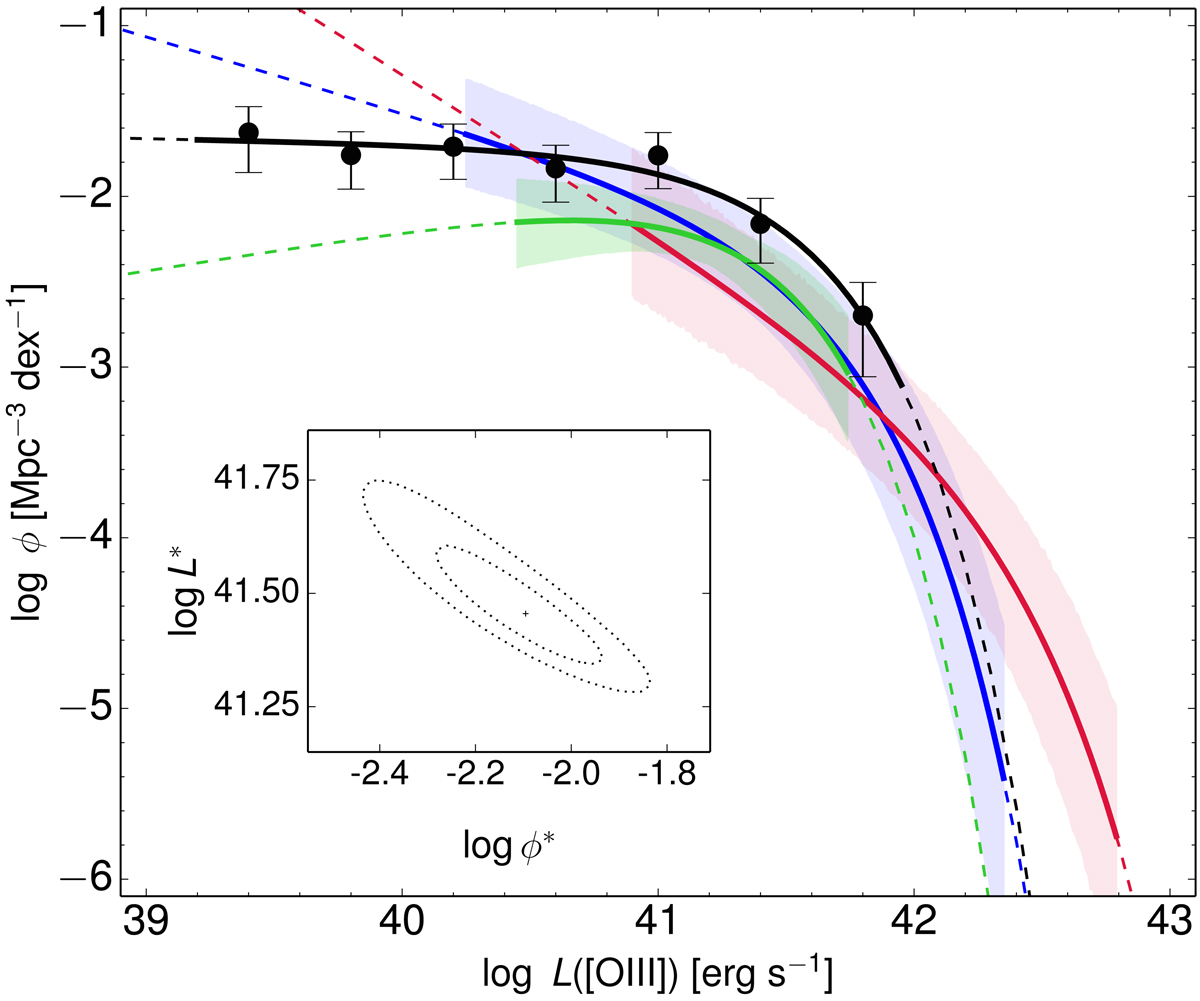
Completeness-corrected [O III] luminosity functions at ⟨z⟩∼0.8 from the recent literature and OTELO survey data. The observed (i.e. with no correction by dust attenuation) LFs of Ly et al. (2007), Drake et al. (2013), Hayashi et al. (2018) are plotted in blue, green, and red, respectively. In each case, the solid line extends over the sampled luminosities in each survey, while the dashed line is the extrapolation of the corresponding best fit. The colour-shaded areas depict the propagated uncertainties of the cited LFs. The black curve represents the best fit of the Schechter function to the OTELO LF([O III]) data (dots). Error bars are the result of the LF uncertainty scheme per bin as detailed in Sect. 6.4. The relevant data for this LF are given in Table 4. The inset shows the 68% and 90% confidence contours for the OTELO data fit in the space of the parameters that show the largest uncertainties (see text).
Current usage metrics show cumulative count of Article Views (full-text article views including HTML views, PDF and ePub downloads, according to the available data) and Abstracts Views on Vision4Press platform.
Data correspond to usage on the plateform after 2015. The current usage metrics is available 48-96 hours after online publication and is updated daily on week days.
Initial download of the metrics may take a while.