Fig. 4.
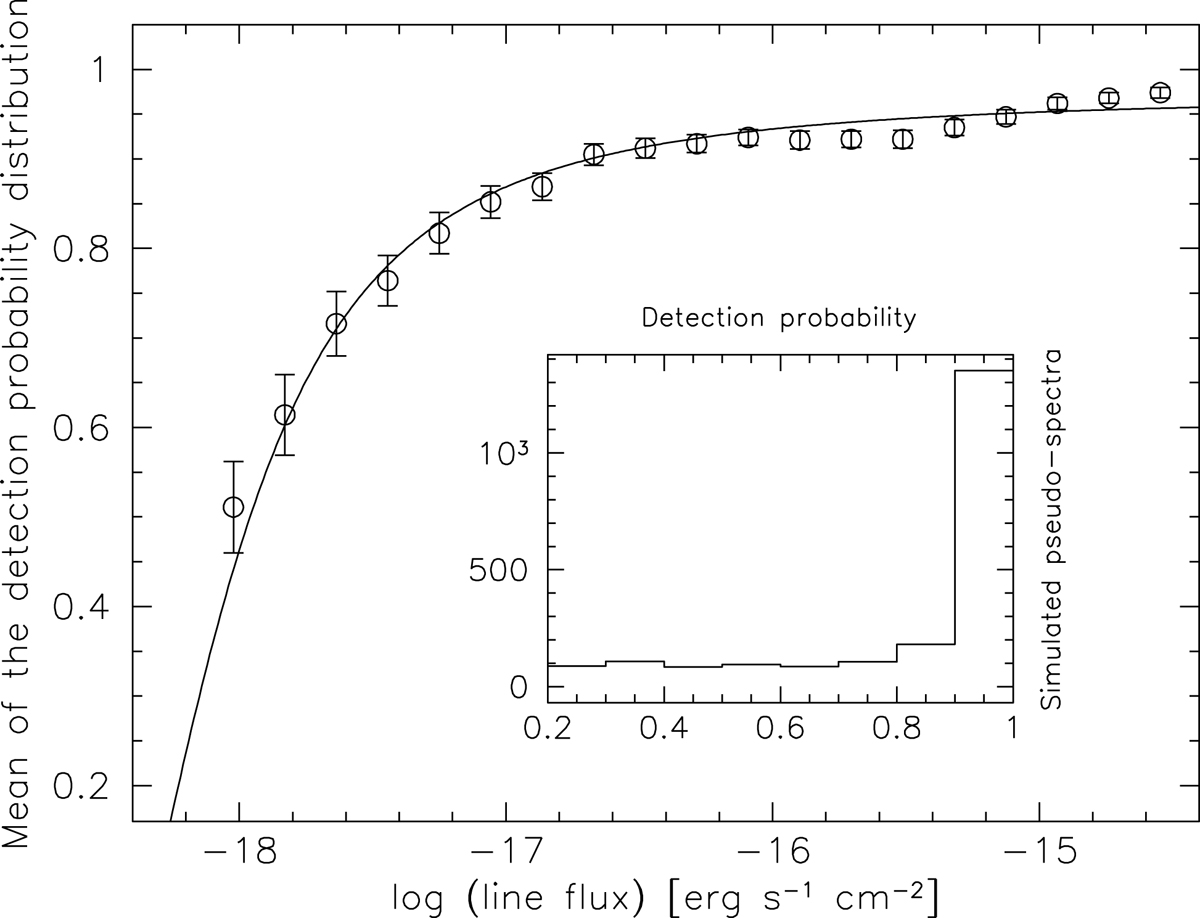
Mean of the detection probability of the [O III] ELSs at ⟨z⟩ = 0.83. The inset shows the detection probability distribution of all simulated pseudo-spectra described in Sect. 4 used to obtain the function represented here. The curve traces the least-squares weighted fit of the sigmoid function used to model such flux-binned mean values. Bars represent the mean standard error used for fit weighting.
Current usage metrics show cumulative count of Article Views (full-text article views including HTML views, PDF and ePub downloads, according to the available data) and Abstracts Views on Vision4Press platform.
Data correspond to usage on the plateform after 2015. The current usage metrics is available 48-96 hours after online publication and is updated daily on week days.
Initial download of the metrics may take a while.