Fig. 2.
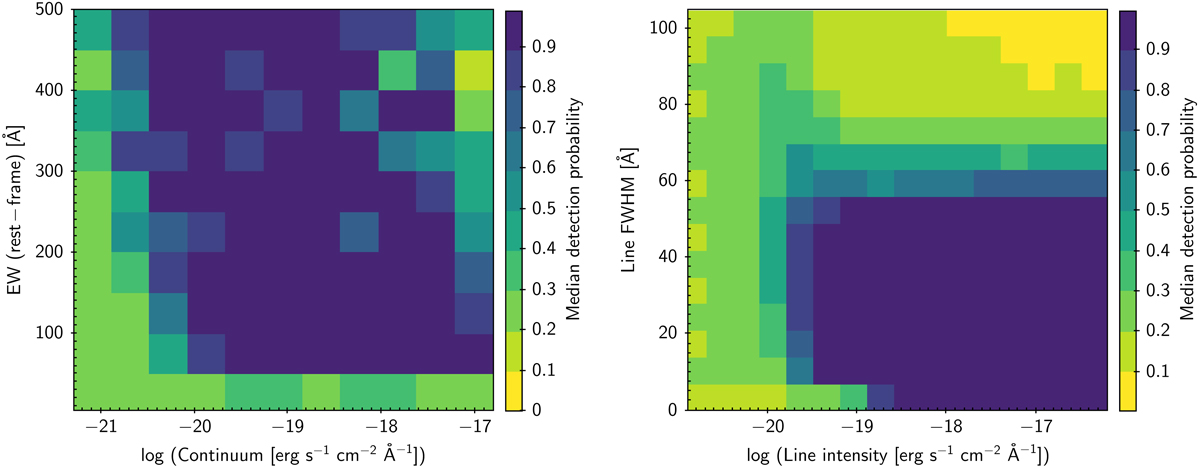
Examples of detection probabilities of ELSs in OTELO from simulations. Left: median detected EW (rest-frame) as a function of the continuum in the input spectra resulting from simulations. Right: median value of detection probability in the line-width–intensity plane after the 500 runs of the simulations described in Sect. 4. The steep downturn of the median detection probability occurs when the emission-line width exceeds ∼60 Å.
Current usage metrics show cumulative count of Article Views (full-text article views including HTML views, PDF and ePub downloads, according to the available data) and Abstracts Views on Vision4Press platform.
Data correspond to usage on the plateform after 2015. The current usage metrics is available 48-96 hours after online publication and is updated daily on week days.
Initial download of the metrics may take a while.