Fig. 1.
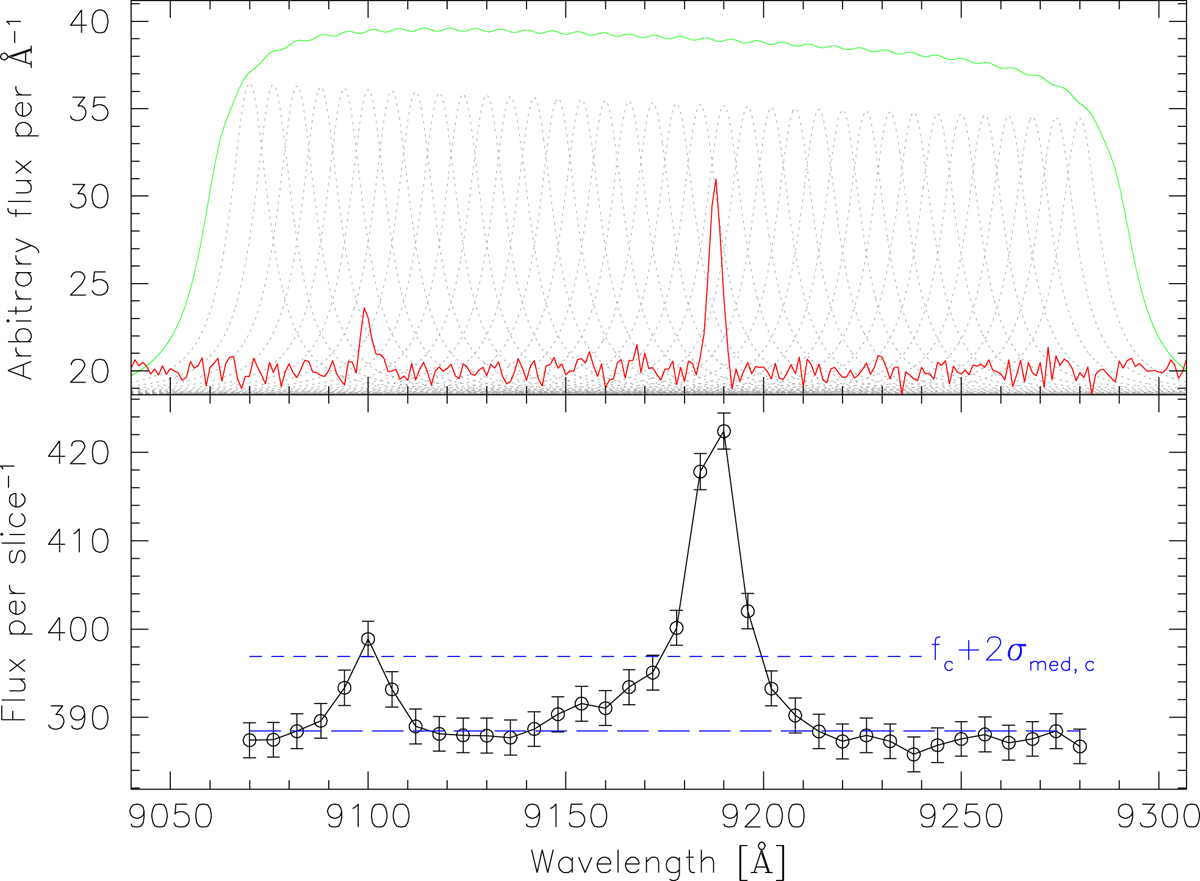
Example of a synthetic pseudo-spectrum of an [O III] λ4959,5007 source as seen by OTELO. Upper panel: synthetic spectrum (in red) with arbitrary flux density consisting of a flat continuum plus two emission lines with Gaussian profiles (FWHM = 2 Å) modelling the [O III] doublet at z = 0.835, with Poissonian noise added. The grey dotted curves represent the Airy instrumental profiles of the OTELO RTF scan. These individual profiles can be synthesised into a custom filter response (green curve), which is useful to obtain an integrated IB flux. Lower panel: pseudo-spectrum obtained from the convolution of the synthetic spectrum in the upper panel with these Airy profiles, mimicking the OTELO data. The blue short-dashed line represents the 2σmed, c level above the median flux or pseudo-continuum (blue long-dashed line) defined in the main text. Flux density between both spectra differs by a factor equal to the effective passband δλe of an RTF slice.
Current usage metrics show cumulative count of Article Views (full-text article views including HTML views, PDF and ePub downloads, according to the available data) and Abstracts Views on Vision4Press platform.
Data correspond to usage on the plateform after 2015. The current usage metrics is available 48-96 hours after online publication and is updated daily on week days.
Initial download of the metrics may take a while.