Fig. 6.
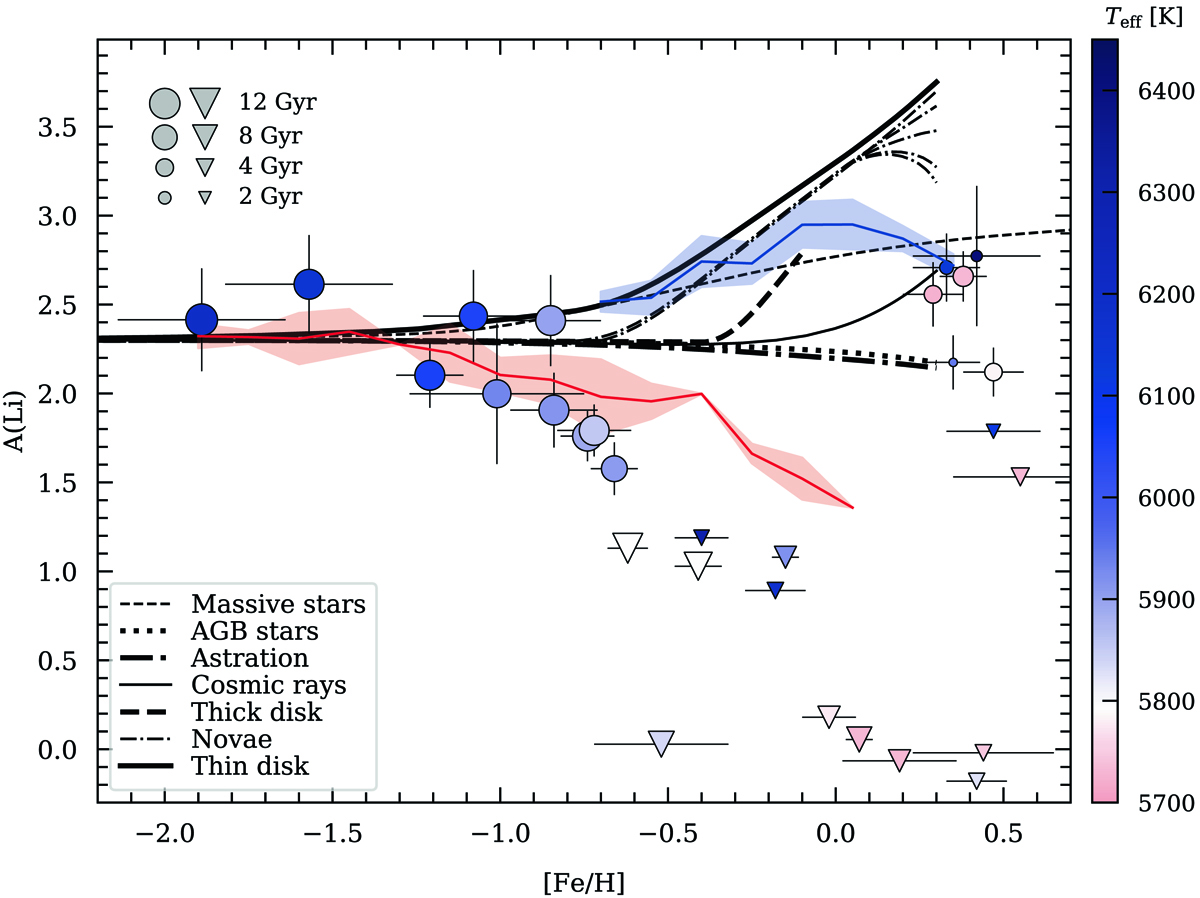
Comparison between the microlensed bulge dwarfs, the running mean A(Li) trends for the thin disk (younger than 8 Gyr, blue line), and thick disk stars (older than 8 Gyr, red line) from Bensby & Lind (2018), and the different A(Li) evolution models from Grisoni et al. (2019). The microlensed dwarf stars are colour coded with their effective temperatures (same scale as in previous figures) and their sizes are scaled based on the estimated ages. The figure only includes bulge stars with effective temperatures greater than 5700 K. The different chemical evolution models of Li are indicated in the legend.
Current usage metrics show cumulative count of Article Views (full-text article views including HTML views, PDF and ePub downloads, according to the available data) and Abstracts Views on Vision4Press platform.
Data correspond to usage on the plateform after 2015. The current usage metrics is available 48-96 hours after online publication and is updated daily on week days.
Initial download of the metrics may take a while.