Fig. 4.
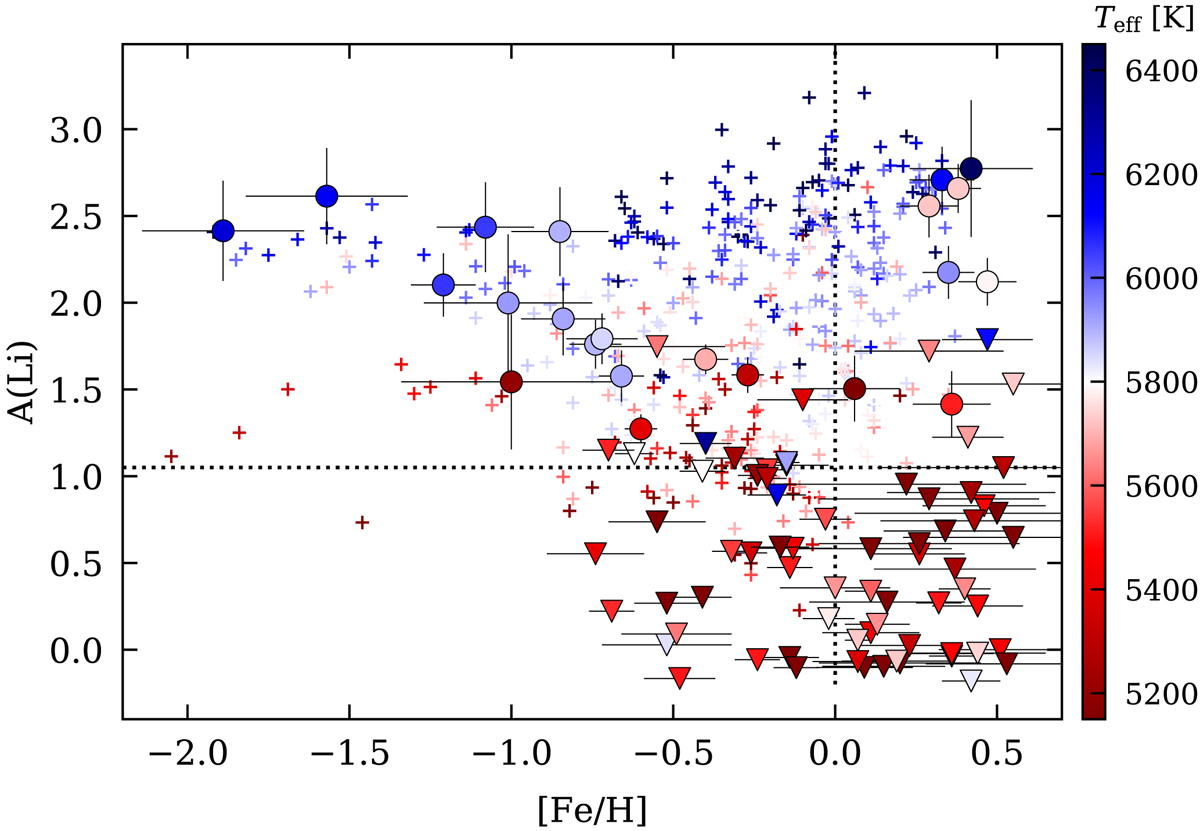
Li abundances vs. Teff for the microlensed dwarf sample. The stars are colour coded based on the effective temperatures of the stars. Triangles represent those stars for which we can only determine upper limits on the abundances. The grey plus signs in the background represent the 714 stars from Bensby et al. (2014) for which Li abundances were determined in Bensby & Lind (2018) in the exact same way as for the microlensed bulge dwarfs. The dotted lines show the solar values with the solar photospheric Li abundance taken from Asplund et al. (2009).
Current usage metrics show cumulative count of Article Views (full-text article views including HTML views, PDF and ePub downloads, according to the available data) and Abstracts Views on Vision4Press platform.
Data correspond to usage on the plateform after 2015. The current usage metrics is available 48-96 hours after online publication and is updated daily on week days.
Initial download of the metrics may take a while.