Fig. 2.
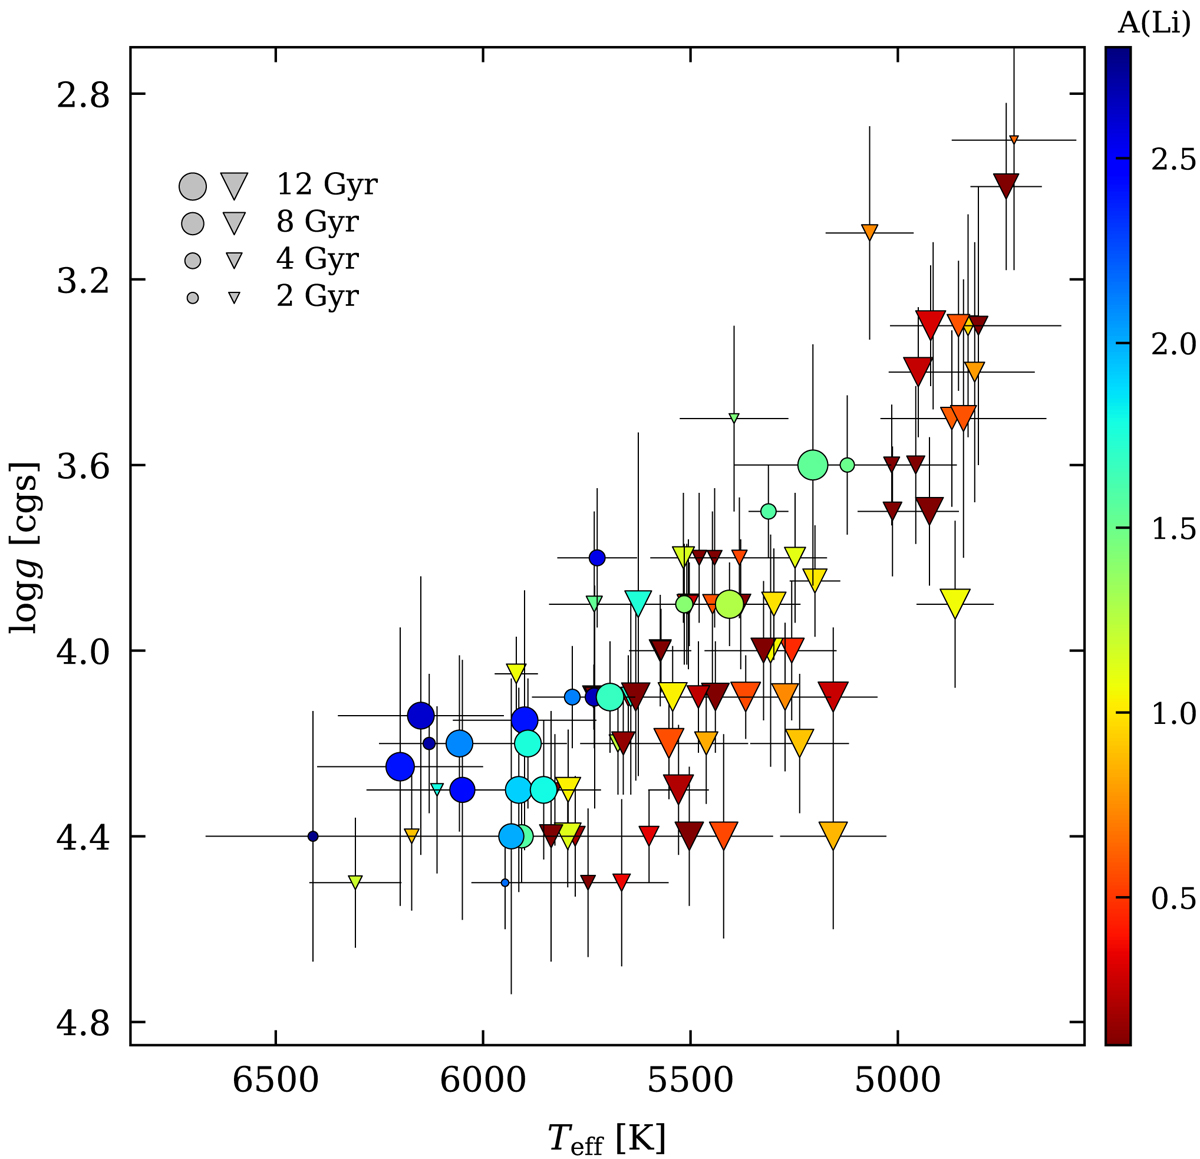
Hertzsprung Russell diagram for microlensed dwarf sample. The stars are colour coded based on the measured Li abundances (according to the colour bar on the right-hand side). Triangles represent those stars for which only upper abundance limits could be determined. The sizes of the markers are scaled with the estimated ages of the stars.
Current usage metrics show cumulative count of Article Views (full-text article views including HTML views, PDF and ePub downloads, according to the available data) and Abstracts Views on Vision4Press platform.
Data correspond to usage on the plateform after 2015. The current usage metrics is available 48-96 hours after online publication and is updated daily on week days.
Initial download of the metrics may take a while.