Fig. 1.
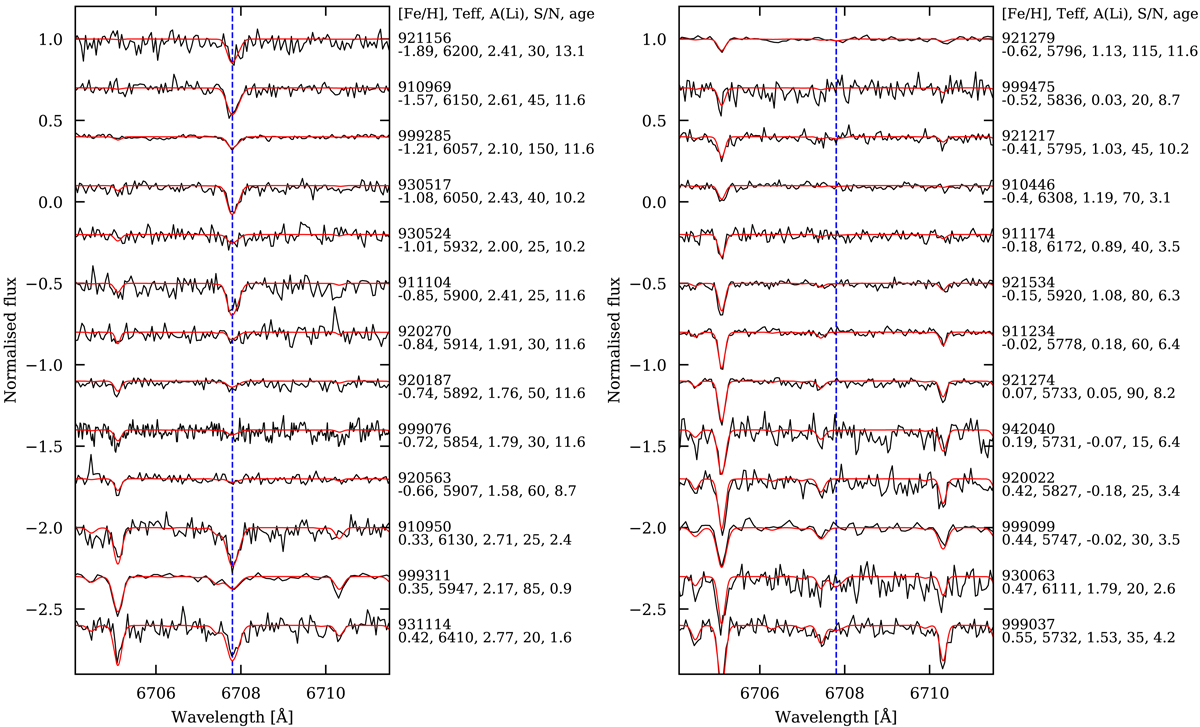
Left-hand side: normalised spectra for 13 stars that have Teff > 5800 K and where the Li line at 6707.8 Å could be detected and the Li abundance measured. The vertical dotted line shows the wavelength where the Li line is located and the red solid lines show the best-fitting synthetic spectra. Right-hand side: normalised spectra for 13 stars that have Teff > 5700 K and where the Li line at 6707.8 Å could not be detected, and only A(Li) upper limits could be determined. The vertical dotted line shows the location where the Li line should be. For each spectrum we give [Fe/H], Teff, A(Li), the measured S/N per pixel, and the age of the star.
Current usage metrics show cumulative count of Article Views (full-text article views including HTML views, PDF and ePub downloads, according to the available data) and Abstracts Views on Vision4Press platform.
Data correspond to usage on the plateform after 2015. The current usage metrics is available 48-96 hours after online publication and is updated daily on week days.
Initial download of the metrics may take a while.