Fig. 3.
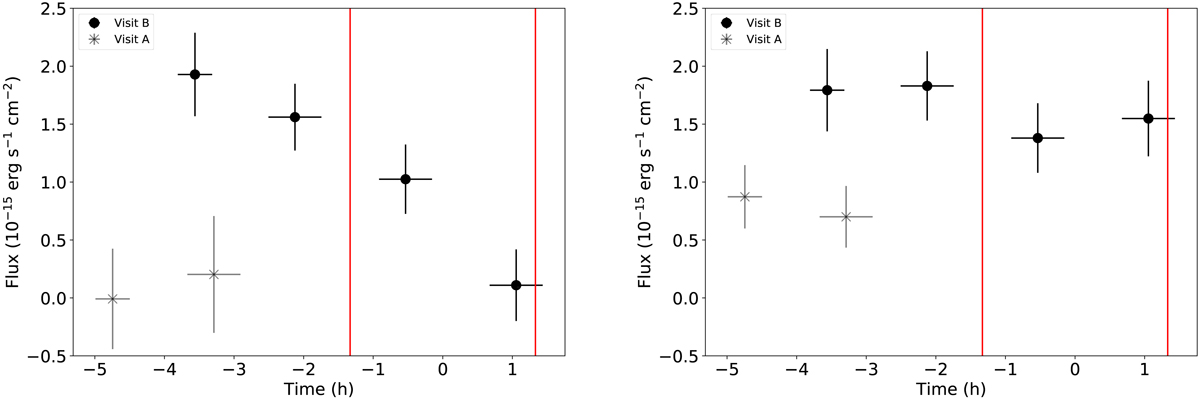
Light curves of the blue (left panel) and red (right panel) wings of the Lyman-α emission of K2-18 during the transit of planet b. Time = 0 corresponds to the transit center according to the ephemeris of Benneke et al. (2019). The vertical red lines represent the ingress and egress of K2-18 b. Visit A was affected by strong geocoronal contamination, and therefore the measured stellar fluxes are likely inaccurate.
Current usage metrics show cumulative count of Article Views (full-text article views including HTML views, PDF and ePub downloads, according to the available data) and Abstracts Views on Vision4Press platform.
Data correspond to usage on the plateform after 2015. The current usage metrics is available 48-96 hours after online publication and is updated daily on week days.
Initial download of the metrics may take a while.