Fig. 1.
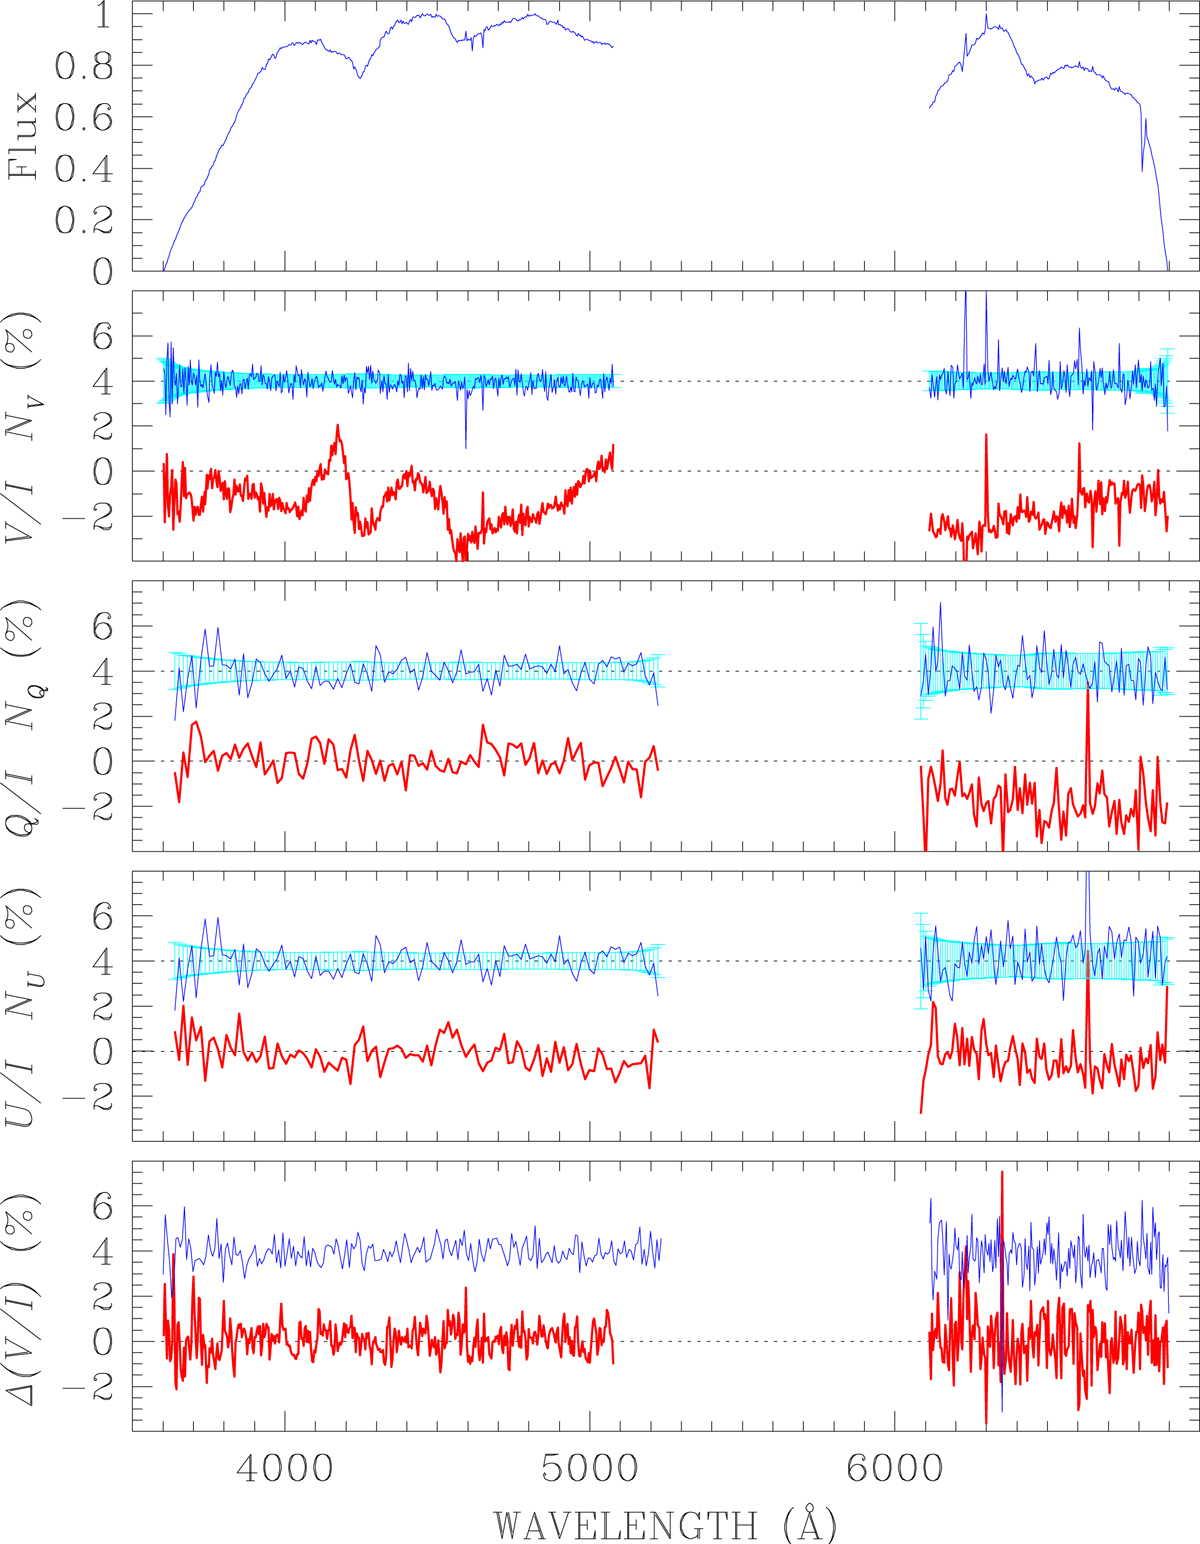
Upper panel: observed flux, each segment normalised separately to 1.0, and not corrected for transmission functions. Second panel from top: V/I spectra obtained on 2019 October 7, and null spectra offset by +4% for display purpose. Superposed to the null spectra are the error bars on Stokes V/I. Third and fourth panel from the top: same as the second panel, but for Q/I and U/I, respectively; data obtained on 2019 October 8. Bottom panel: difference between circular polarised spectra obtained on 2019 October 8 and 7, and, offset by +4%, the null spectra obtained on 2019 October 7.
Current usage metrics show cumulative count of Article Views (full-text article views including HTML views, PDF and ePub downloads, according to the available data) and Abstracts Views on Vision4Press platform.
Data correspond to usage on the plateform after 2015. The current usage metrics is available 48-96 hours after online publication and is updated daily on week days.
Initial download of the metrics may take a while.