Fig. 4.
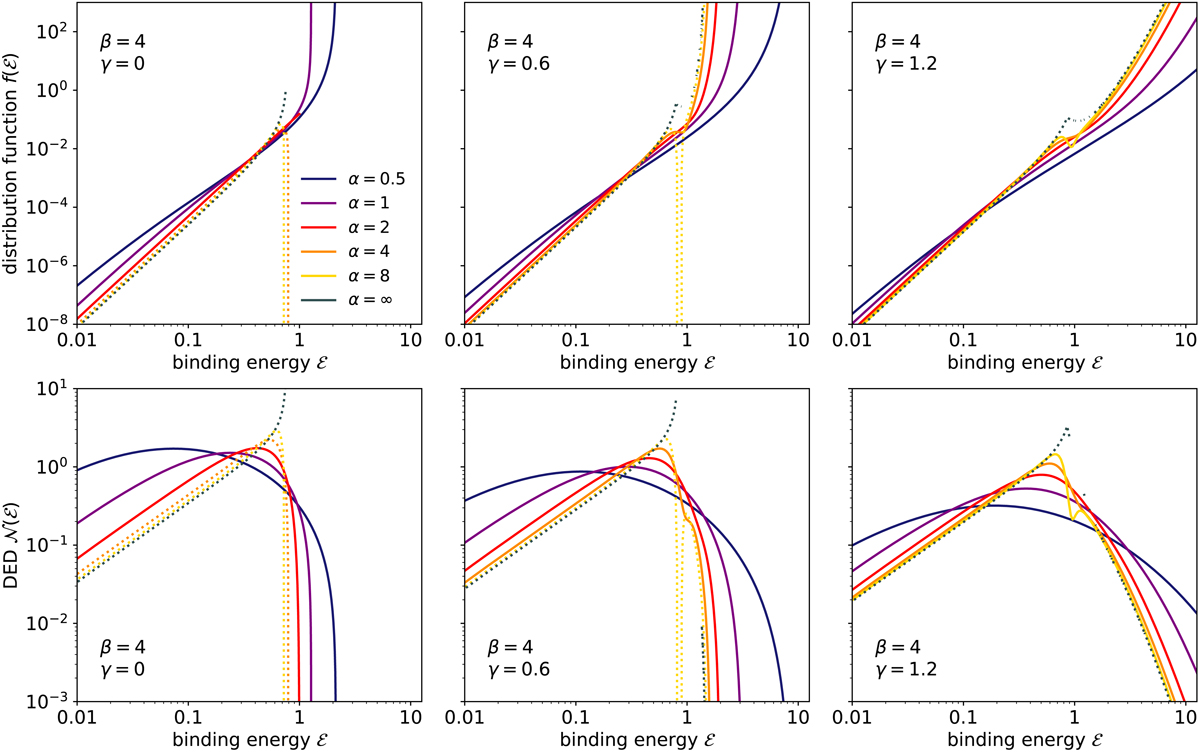
Distribution function (top) and differential energy distribution (bottom) for the family of isotropic Nuker models. The selection of models and the meaning of the different lines are as in Fig. 1. Dotted lines correspond to unphysical models, that is, models that have a negative distribution function in some region of phase space.
Current usage metrics show cumulative count of Article Views (full-text article views including HTML views, PDF and ePub downloads, according to the available data) and Abstracts Views on Vision4Press platform.
Data correspond to usage on the plateform after 2015. The current usage metrics is available 48-96 hours after online publication and is updated daily on week days.
Initial download of the metrics may take a while.