Fig. 1.
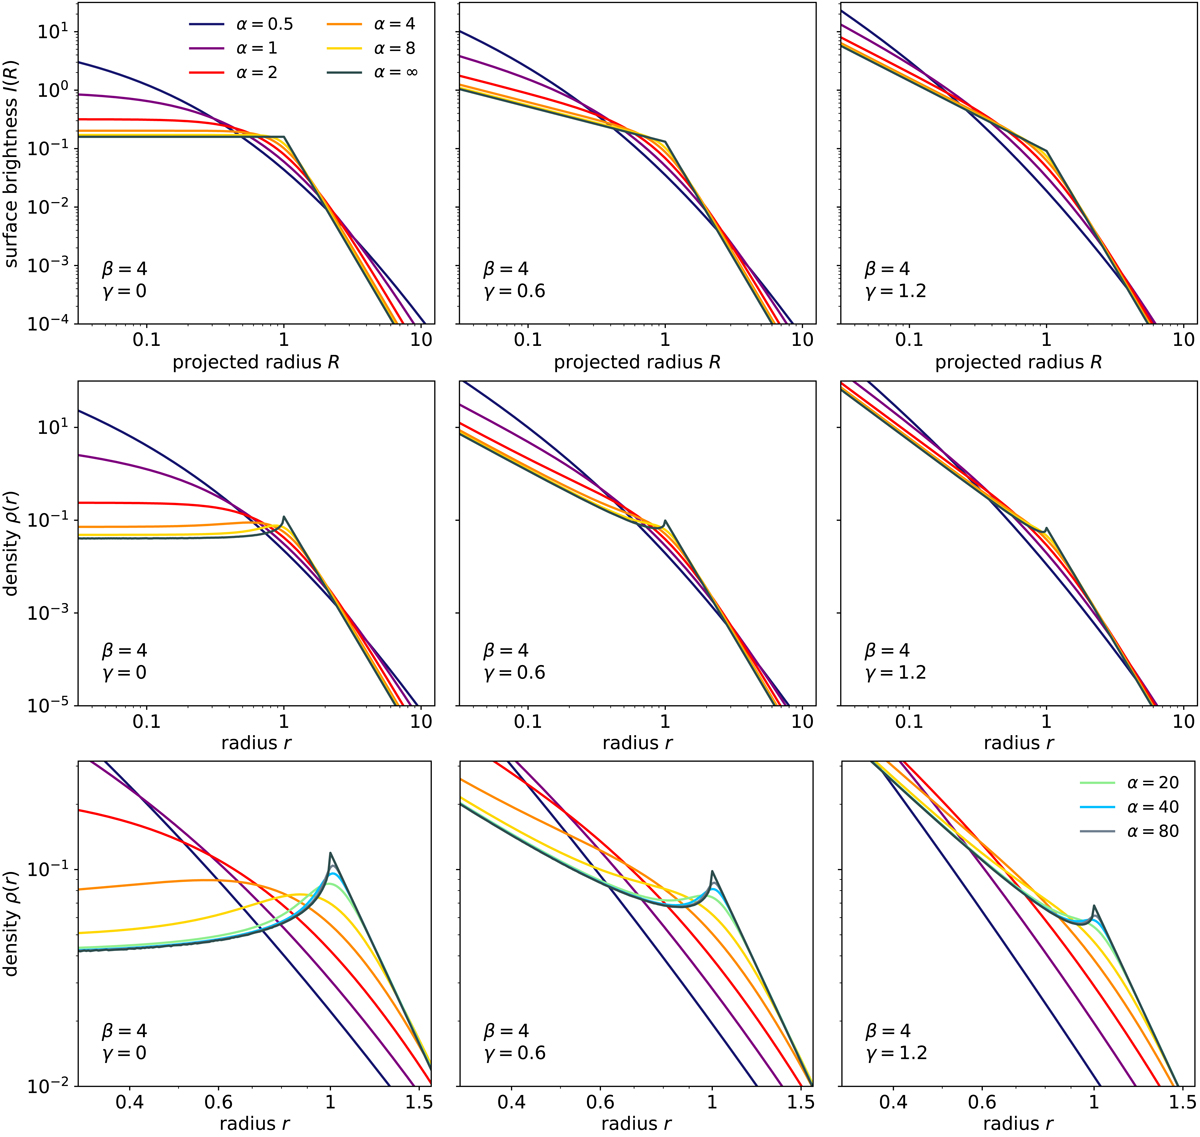
Surface brightness profile (top row) and density profile (second row) for the family of Nuker models. The three columns correspond to different values of γ and different lines within each panel correspond to different values of α. Panels on the bottom row: zoom in on the density profile around the break radius r = 1 and contain additional Nuker models with larger values of α.
Current usage metrics show cumulative count of Article Views (full-text article views including HTML views, PDF and ePub downloads, according to the available data) and Abstracts Views on Vision4Press platform.
Data correspond to usage on the plateform after 2015. The current usage metrics is available 48-96 hours after online publication and is updated daily on week days.
Initial download of the metrics may take a while.