Fig. 1.
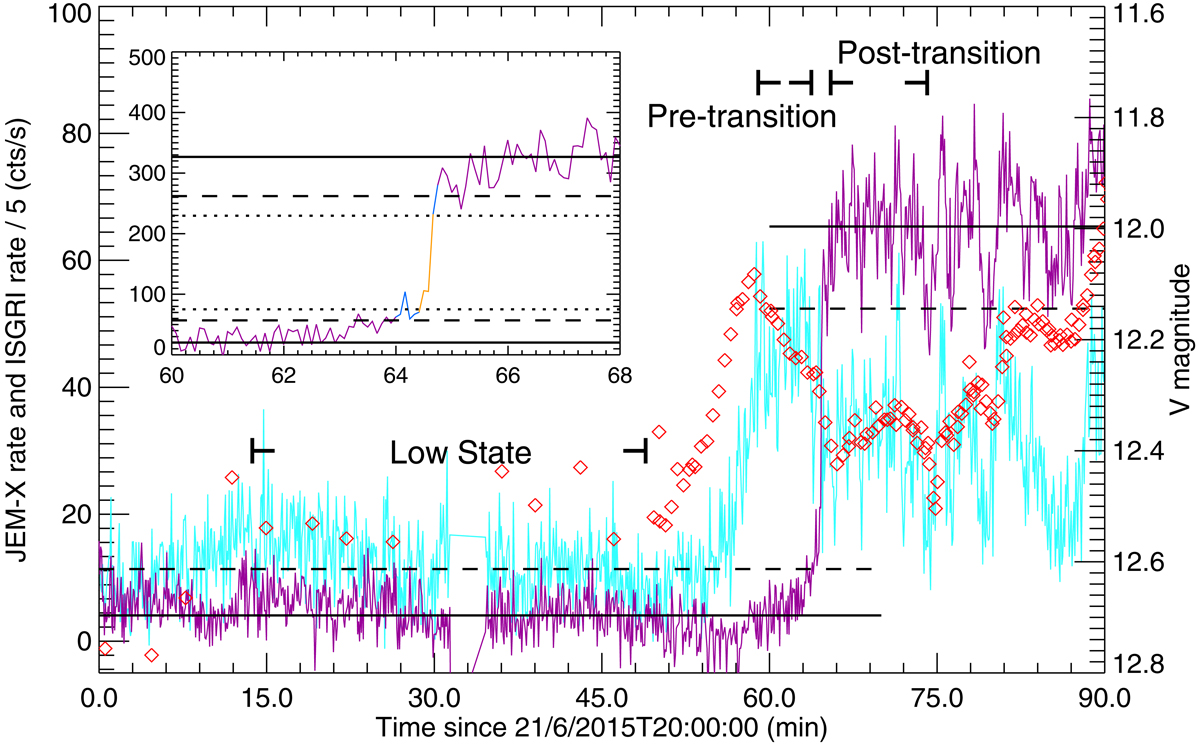
Light curves of the transition. The cyan line shows the JEM-X count rate (3–10 keV; left y-axis), the purple line shows the ISGRI count rate (20–40 keV; y-axis, count rate divided by 5 for better scaling), and the red diamonds show the optical V-filter light curve (right axis). The solid and dashed lines show the low-state and the post-transition mean ISGRI count rate and the 2σ deviation from it, respectively. The inset shows a zoom-in of the transition, with blue and yellow lines indicating the deviation from 2σ and 3σ deviation (dotted line) from the low-state and post-transition mean count rates, respectively.
Current usage metrics show cumulative count of Article Views (full-text article views including HTML views, PDF and ePub downloads, according to the available data) and Abstracts Views on Vision4Press platform.
Data correspond to usage on the plateform after 2015. The current usage metrics is available 48-96 hours after online publication and is updated daily on week days.
Initial download of the metrics may take a while.