Fig. 2
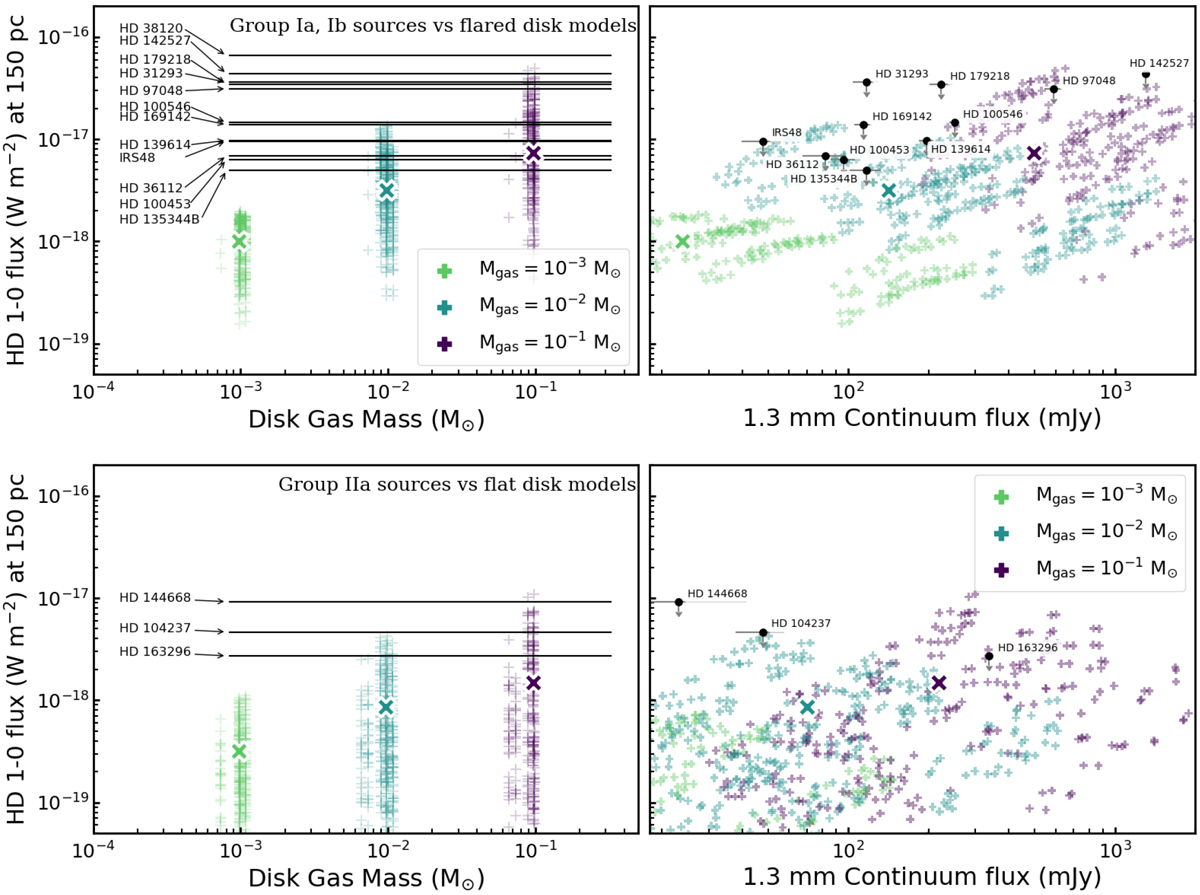
Distance-normalised 3σ upper limits on HD 112 μm line flux forthe disc sample (black lines and circles) compared with our grid of DALI disc models (coloured crosses). Highlighted crosses show the HD 112 μm line flux ofour fiducial model. The top panels show the group I sources compared to models with flaring angle ψ = 0.3. The bottom panels show the group II sources compared to models with ψ = 0.0. Left: models are separated based on gas mass. Right: HD 1–0 upper limitsset against 1.3 mm continuum fluxes for both observations and models.
Current usage metrics show cumulative count of Article Views (full-text article views including HTML views, PDF and ePub downloads, according to the available data) and Abstracts Views on Vision4Press platform.
Data correspond to usage on the plateform after 2015. The current usage metrics is available 48-96 hours after online publication and is updated daily on week days.
Initial download of the metrics may take a while.