Free Access
Fig. 1
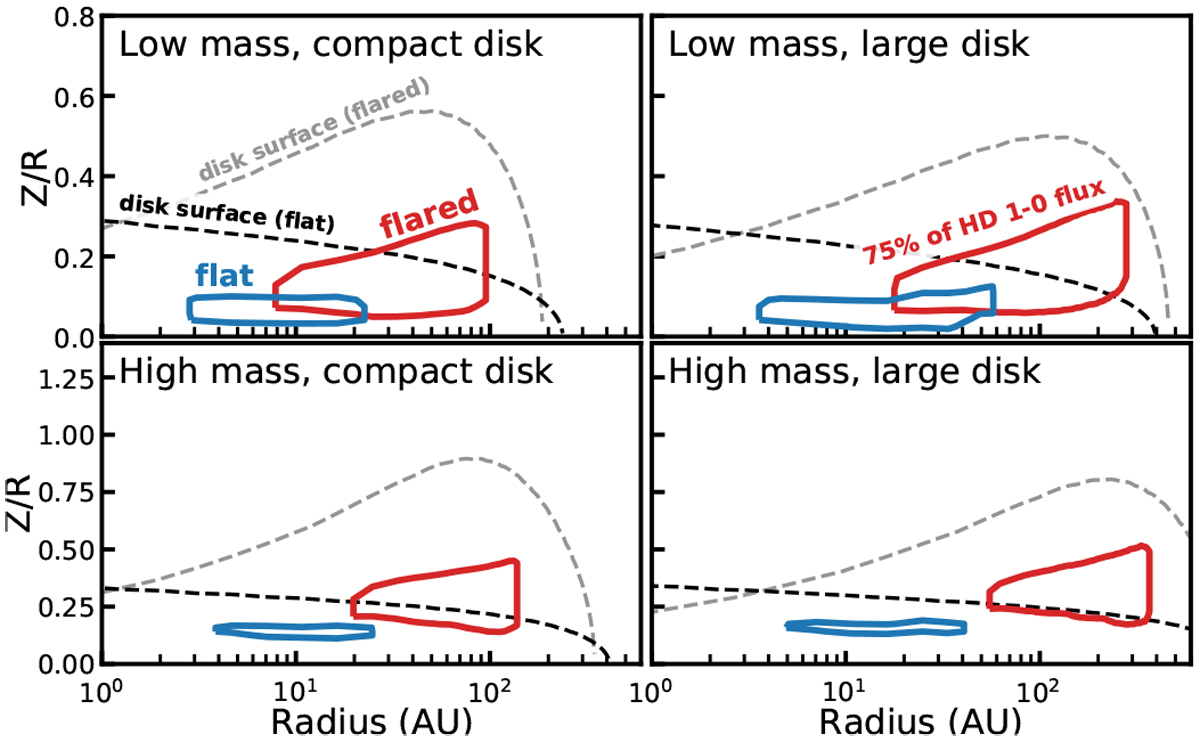
HD1–0 line emitting regions in our flat/cold (blue) and flared/warm (red) disc models. Solid contours contain the middle 75% of cumulative line emission. Dashed lines indicate gas number density iso-contours for ngas = 106 cm−3, acting as a disc outline.
Current usage metrics show cumulative count of Article Views (full-text article views including HTML views, PDF and ePub downloads, according to the available data) and Abstracts Views on Vision4Press platform.
Data correspond to usage on the plateform after 2015. The current usage metrics is available 48-96 hours after online publication and is updated daily on week days.
Initial download of the metrics may take a while.