Fig. 4.
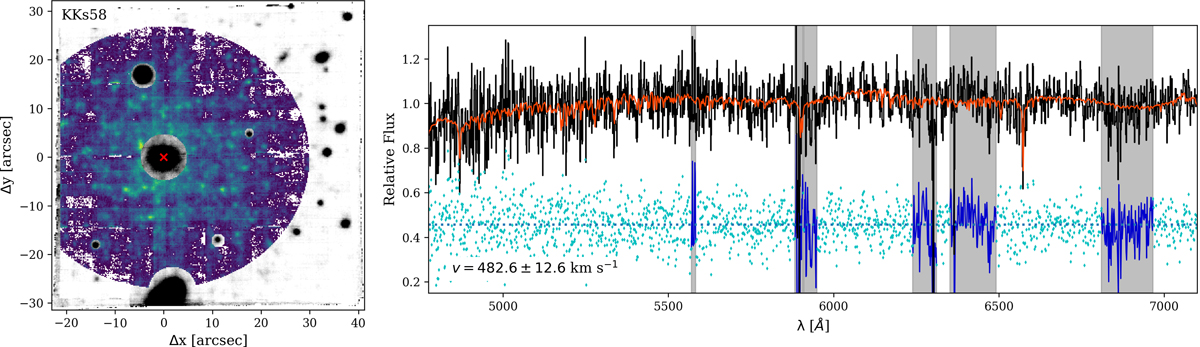
Extraction of the KKs58 galaxy spectrum. Left: white-light image of KKs58, created by collapsing the MUSE cube along the spectral axis (10″ ≈ 160 pc). The position of the NSC is marked by the red cross. We show the mask that is used for the extraction of the integrated galaxy spectrum in green-blue colours while the masked pixels are shown with are in black and white. Right: PPXF fit to the normalised integrated spectrum of KKs58. The input spectrum is shown in black and the best-fitting combination of MILES SSP models is shown in red. The blue points indicate the residual, shifted to 0.5 for visibility. Masked regions with strong sky residual lines appear as grey-shaded. We only use the spectral range from 4500 to 7100 Å because the spectrum is heavily contaminated by sky residual and telluric lines at larger wavelengths.
Current usage metrics show cumulative count of Article Views (full-text article views including HTML views, PDF and ePub downloads, according to the available data) and Abstracts Views on Vision4Press platform.
Data correspond to usage on the plateform after 2015. The current usage metrics is available 48-96 hours after online publication and is updated daily on week days.
Initial download of the metrics may take a while.