Fig. 3.
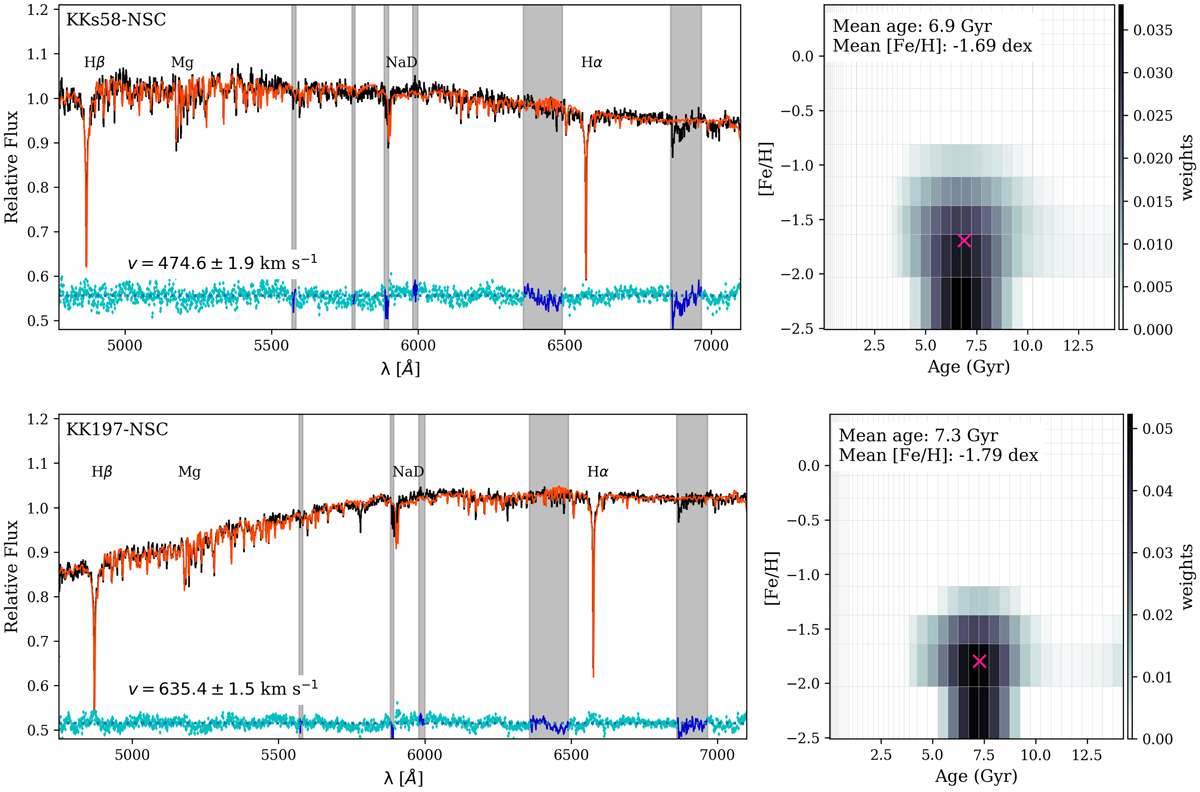
Normalised spectrum of KKs58-NSC (top) and KK197-NSC (bottom) fitted with PPXF and the scaled-solar MILES models. The input spectrum of the NSC is shown in black and the best-fitting combination of MILES SSP models is shown in red. The blue points indicate the residual, shifted to 0.5 for visibility. Masked regions with strong sky residual lines appear as grey-shaded. Right panels: available grid of MILES SSP models in age and metallicity, colour-coded by their weight in the best-fit. The pink crosses mark the position of the weighted mean ages and metallicities. These are not corresponding to our final measurements from MC fitting listed in Table 2.
Current usage metrics show cumulative count of Article Views (full-text article views including HTML views, PDF and ePub downloads, according to the available data) and Abstracts Views on Vision4Press platform.
Data correspond to usage on the plateform after 2015. The current usage metrics is available 48-96 hours after online publication and is updated daily on week days.
Initial download of the metrics may take a while.