Fig. 4.
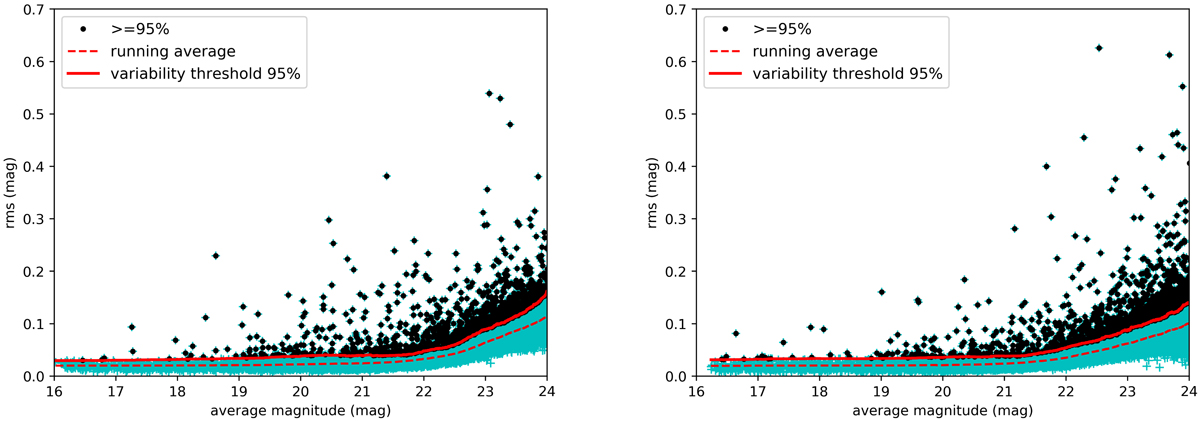
Deviation of rms as a function of the average magnitude for all the selected sources in the CDF-S3 (left panel) and 4 (right panel) detected in at least 20% of epochs. Cyan crosses: selected sources. Solid red line: variability threshold (95th percentile of the rms distribution). Dashed red line: running average of the rms deviation. Black points: variables sources (i.e., above the defined variability threshold).
Current usage metrics show cumulative count of Article Views (full-text article views including HTML views, PDF and ePub downloads, according to the available data) and Abstracts Views on Vision4Press platform.
Data correspond to usage on the plateform after 2015. The current usage metrics is available 48-96 hours after online publication and is updated daily on week days.
Initial download of the metrics may take a while.