Fig. B.2.
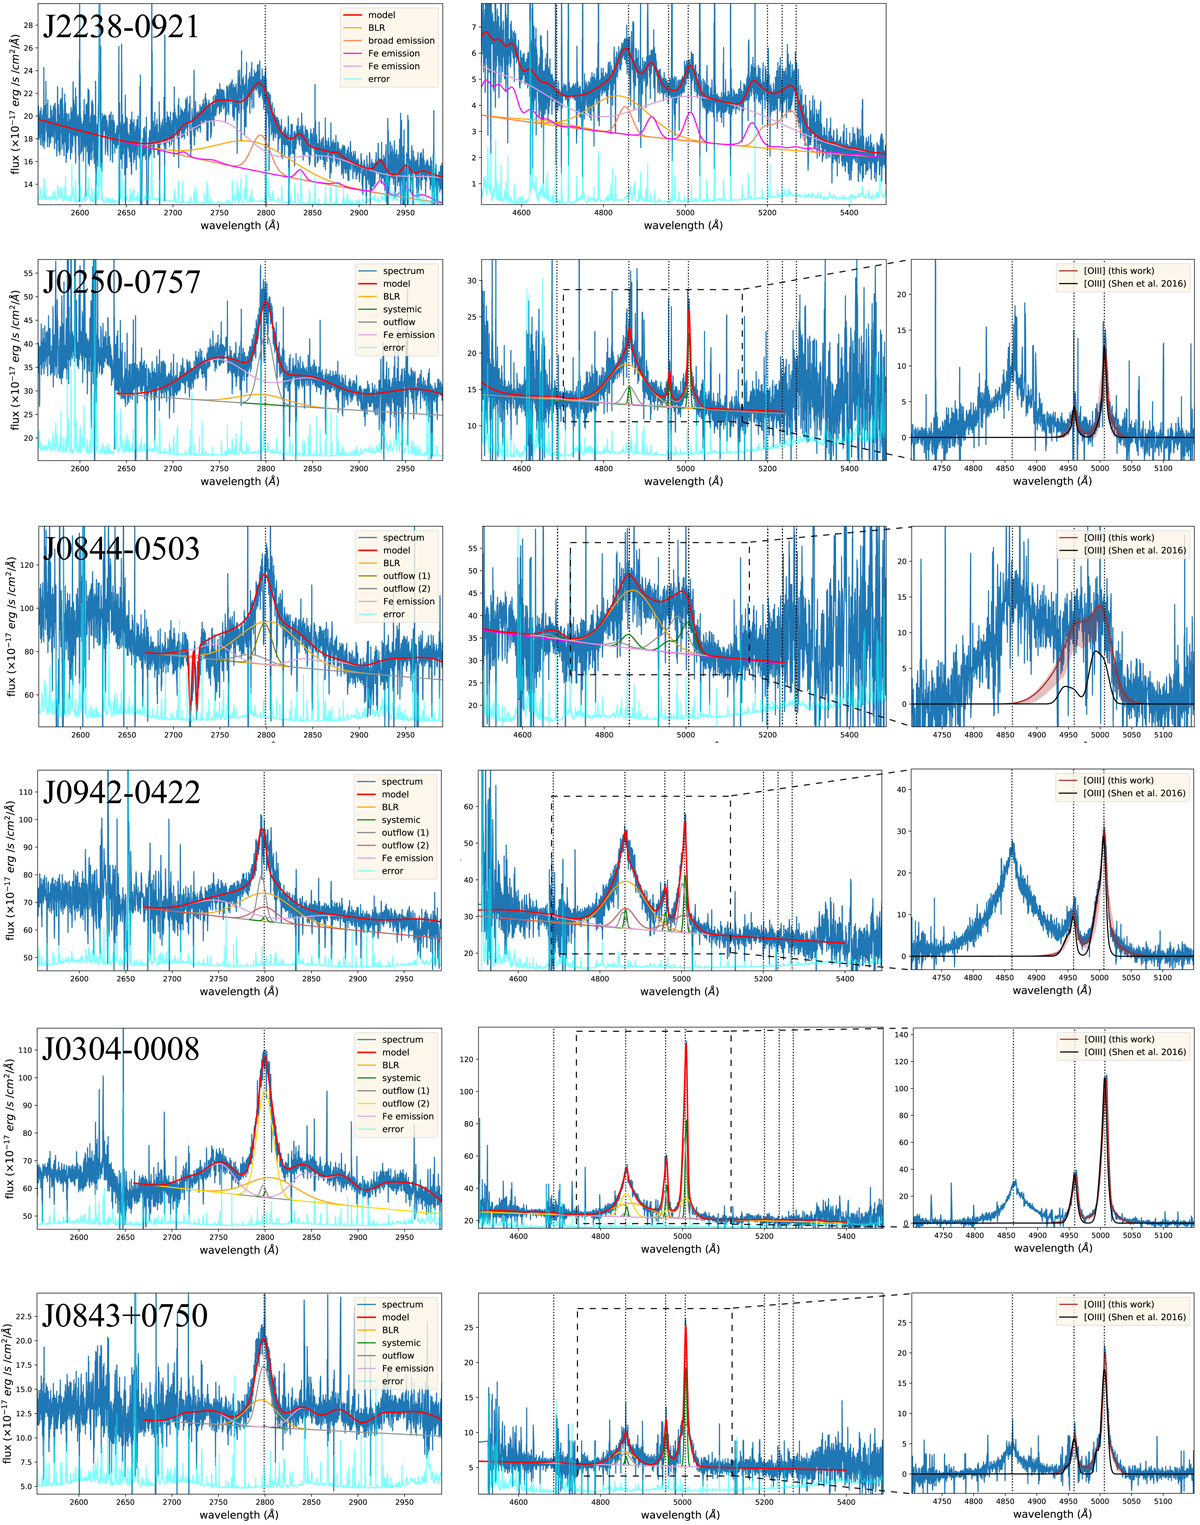
Parametrisation of the MgII+FeII+FeIII (left) and Hβ+[OIII]+FeII (middle and right panels) of z > 2.5 QSO1 from the sample of Shen (2016). The red lines show the best-fit from multiple systemic, outflow, and broad Gaussian profiles to the line features, together with a two local power laws to the continuum and one (two) template(s) to the FeII features (see text). Each curve with a different colour represent a distinct Gaussian set (or a FeII template) with same kinematic properties, as labeled in the figure. In the right panel we show, for each target, the spectrum around the Hβ+[OIII] lines after the subtraction of the continuum. The red curve represents the best-fit retrieval model from MC fits, and the shaded area encompass 68% of the MC sample; the black curve shows the [OIII] best-fit obtained by Shen (2016). For J2238−0921, we do not detect any [OIII] emission line, consistent with Coatman et al. (2019) and at odds with Shen (2016): the peaks at ∼4900, 5000 and 5150 Å are associated with FeII emission (precisely, the 6S iron line group, according to the ordering in Kovačević et al. 2010).
Current usage metrics show cumulative count of Article Views (full-text article views including HTML views, PDF and ePub downloads, according to the available data) and Abstracts Views on Vision4Press platform.
Data correspond to usage on the plateform after 2015. The current usage metrics is available 48-96 hours after online publication and is updated daily on week days.
Initial download of the metrics may take a while.