Fig. 4.
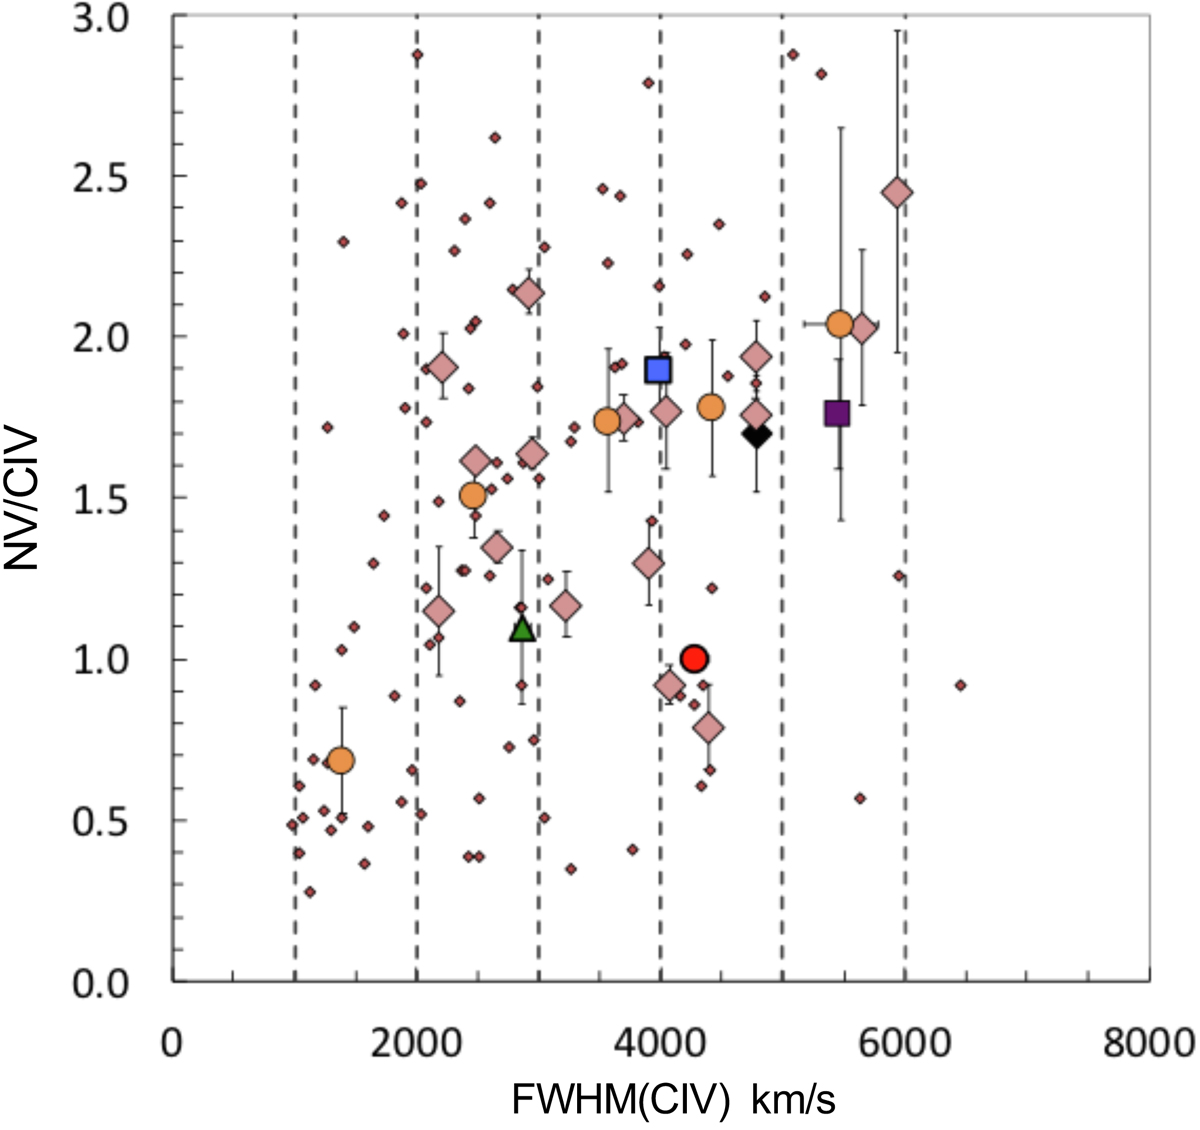
NV/CIV vs. FWHMCIV for the 97 core ERQs in H17. J1714+4148, the four core ERQ from Z16 and the remaining core ERQ in Perrotta et al. (2019) are plotted with the same colour code as in Fig. 1. All other core ERQ from H17 are plotted with small dark red diamonds. The core ERQ are organised into five groups according to the FWHMCIV range of values, indicated with the vertical dashed lines. The median NV/CIV and FWHMCIV in km s−1 of the five groups are shown with large orange circles. The error bars correspond to the standard error on the median values for each group. A clear increase with line width is observed in the NV/CIV ratio.
Current usage metrics show cumulative count of Article Views (full-text article views including HTML views, PDF and ePub downloads, according to the available data) and Abstracts Views on Vision4Press platform.
Data correspond to usage on the plateform after 2015. The current usage metrics is available 48-96 hours after online publication and is updated daily on week days.
Initial download of the metrics may take a while.