Fig. 3.
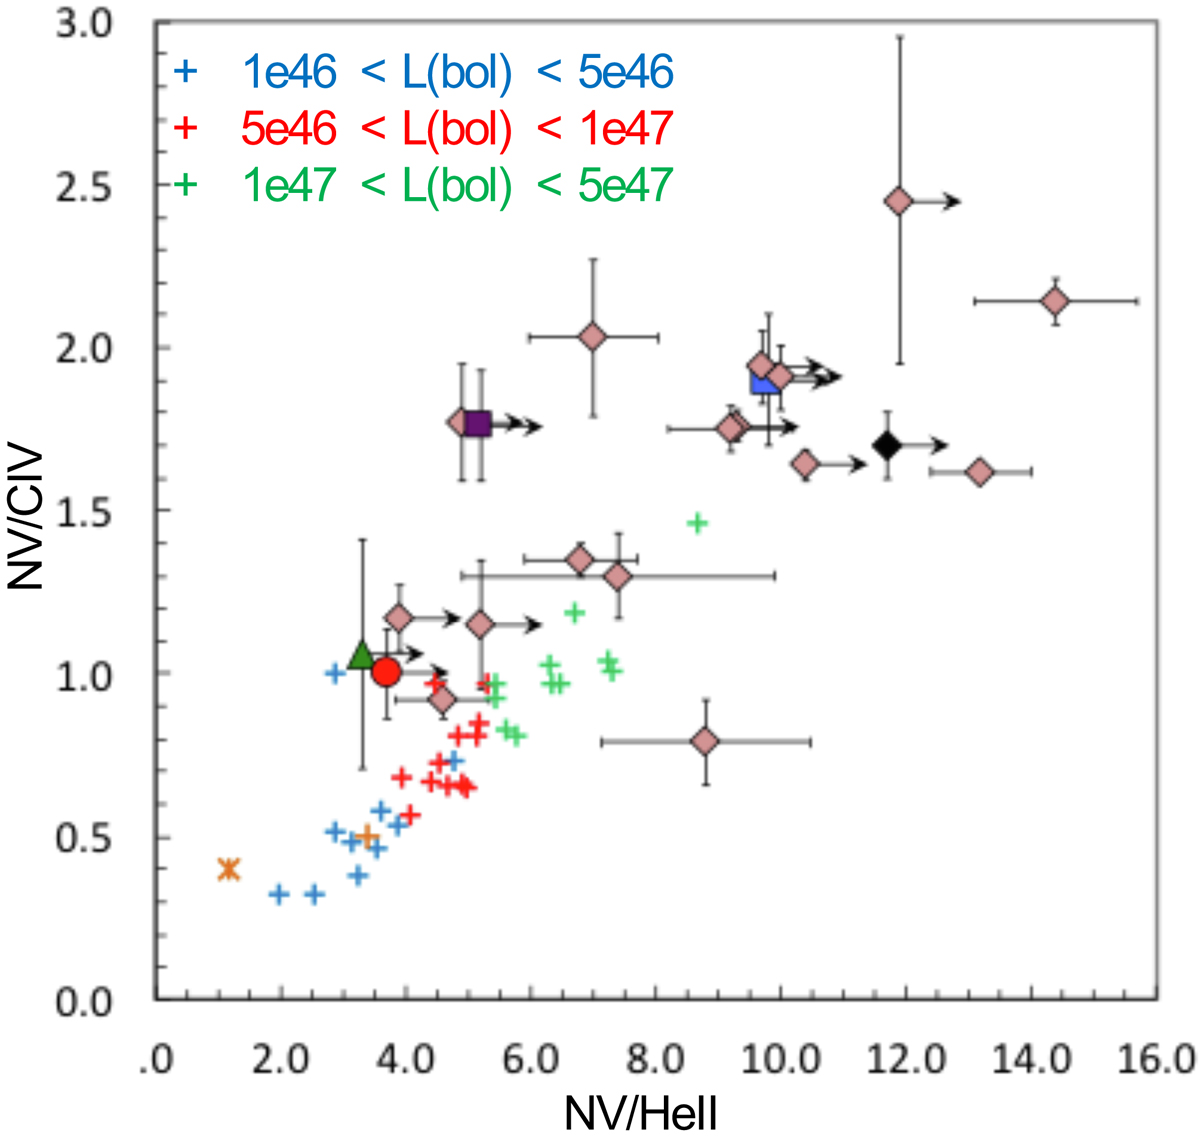
NV ratios and BLR metallicity. The blue, red, and green symbols correspond to the QSO1 bins in which Matsuoka et al. (2011) distributed their QSO1 sample. Each cross represents the location of one given Lbol bin. The colours indicate ranges of increasing Lbol. The median values of QSO2 (Groups 1 and 2) are also shown for comparison with orange symbols (see text).
Current usage metrics show cumulative count of Article Views (full-text article views including HTML views, PDF and ePub downloads, according to the available data) and Abstracts Views on Vision4Press platform.
Data correspond to usage on the plateform after 2015. The current usage metrics is available 48-96 hours after online publication and is updated daily on week days.
Initial download of the metrics may take a while.