Fig. 2.
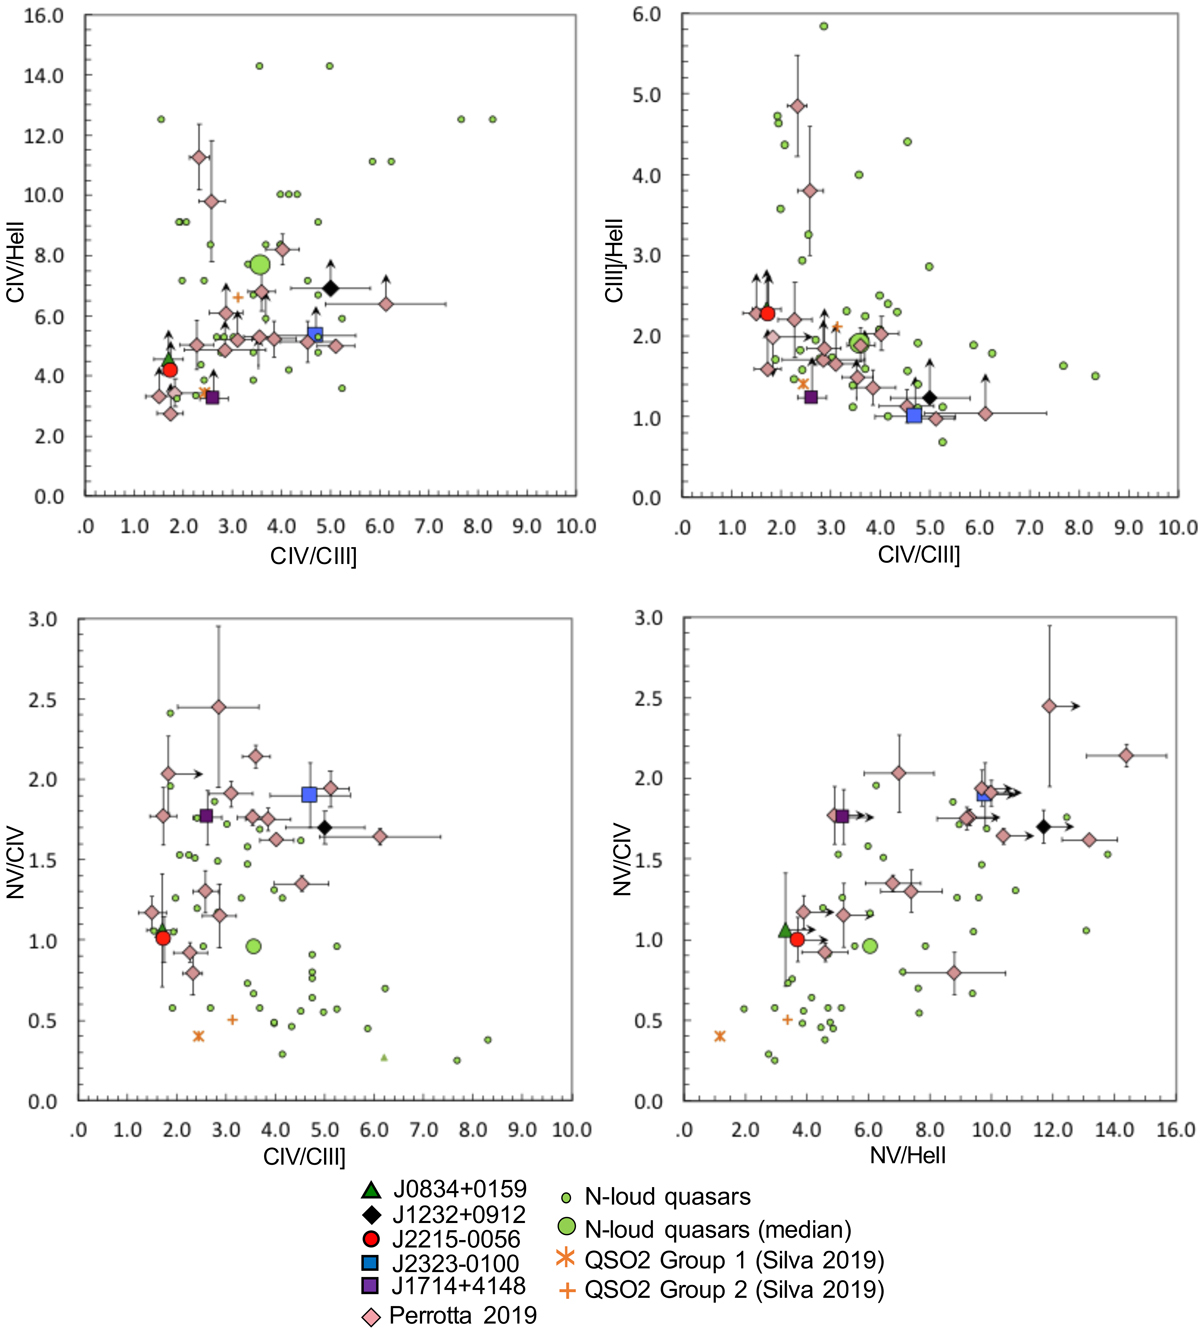
Comparison of the core ERQ UV line ratios with N-loud quasars (Batra & Baldwin 2014) and the median ratios of SDSS QSO2 at z > 2 (Group 1: CIV/HeII < 4 and Group 2: CIV/HeII > 4, Silva et al. 2020). HeIIλ1640 is not detected for most core ERQ, therefore lower limits are shown with arrows for the ratios involving this line. The minimum and maximum y- and x-axis values have been selected in all diagrams to span approximately the full range of values shown by most plotted objects. The core ERQ line ratios (measured and lower or upper limits) partially overlap the area of the diagrams covered by N-loud quasars.
Current usage metrics show cumulative count of Article Views (full-text article views including HTML views, PDF and ePub downloads, according to the available data) and Abstracts Views on Vision4Press platform.
Data correspond to usage on the plateform after 2015. The current usage metrics is available 48-96 hours after online publication and is updated daily on week days.
Initial download of the metrics may take a while.