Fig. 1.
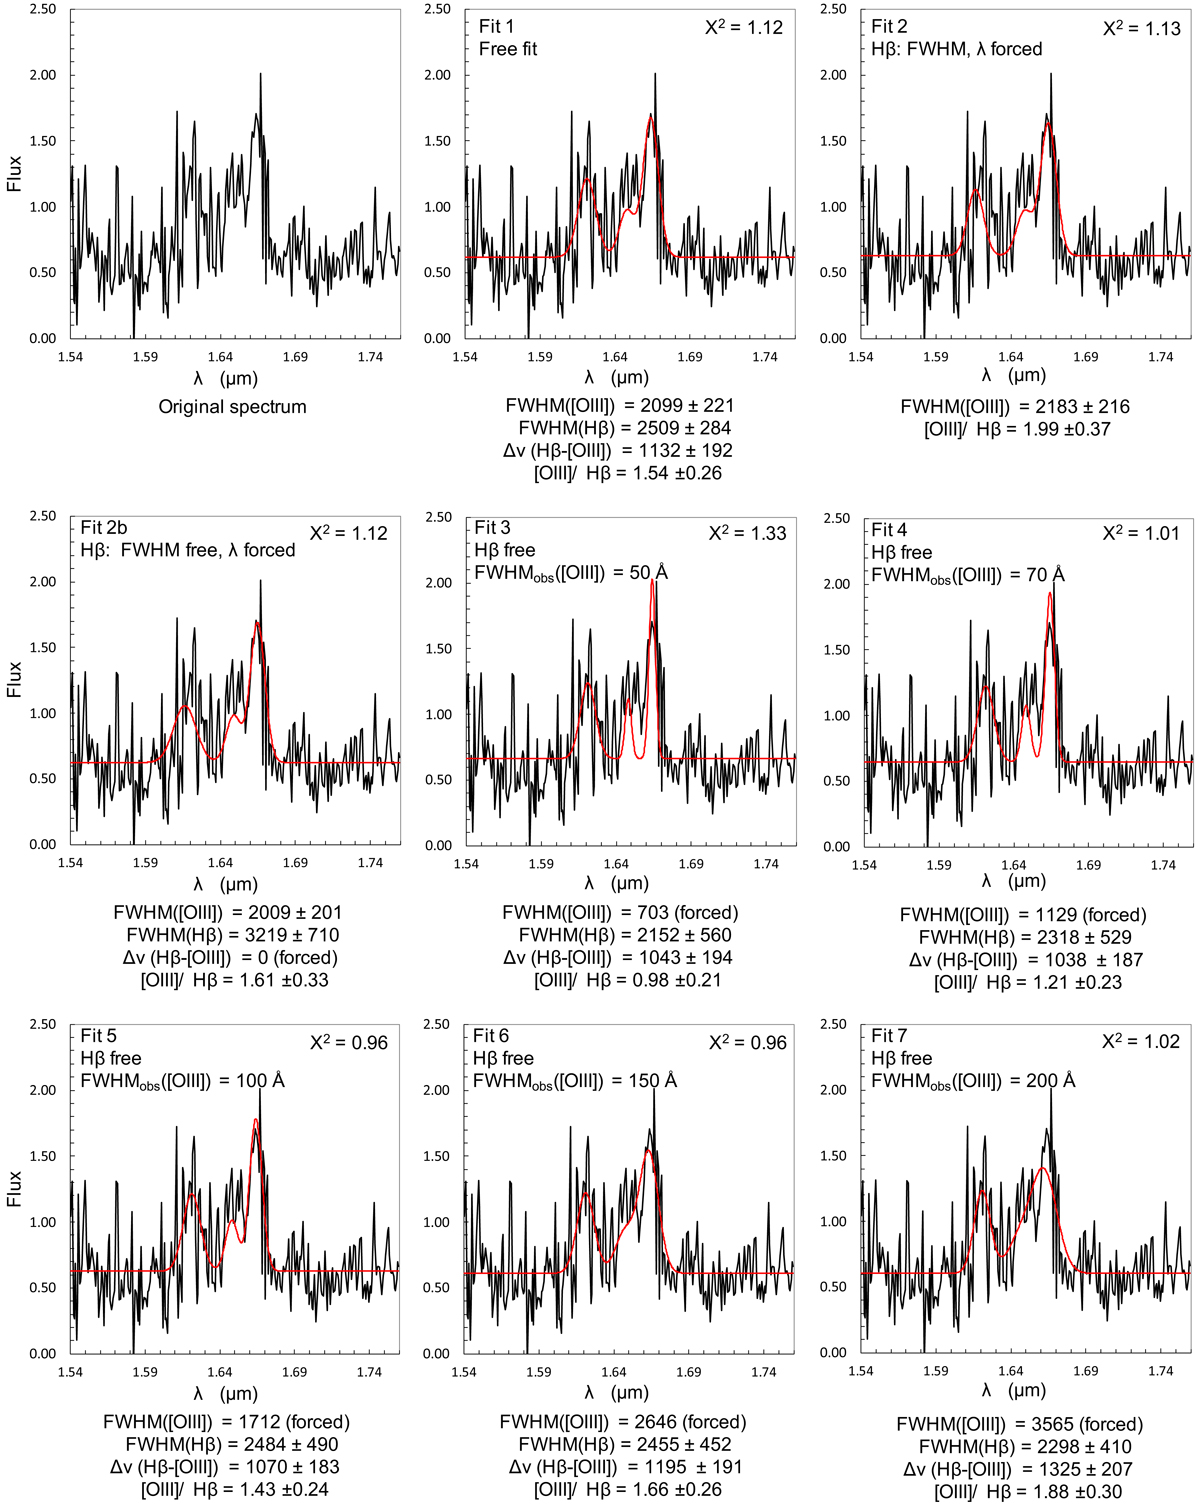
GTC EMIR spectrum of J1714+4148 in the Hβ and [OIII] spectral region (black lines). The flux is in units of ×10−18 erg s−1 cm−2 Å−1. Different fits (red lines) were attempted by applying a variety of kinematic constraints to [OIII] and/or Hβ (fits 2–7) or by leaving the kinematic parameters free (fit 1). For each fit, the constraints on the observed FWHM in Å are shown. It is also specified whether Hβ was forced to have the same redshift as [OIII]λ5007 (λ forced, fits 2 and 2b). The reduced chi-squared χ2 are also shown, and the best-fit profiles are presented underneath each panel.
Current usage metrics show cumulative count of Article Views (full-text article views including HTML views, PDF and ePub downloads, according to the available data) and Abstracts Views on Vision4Press platform.
Data correspond to usage on the plateform after 2015. The current usage metrics is available 48-96 hours after online publication and is updated daily on week days.
Initial download of the metrics may take a while.