Fig. 4.
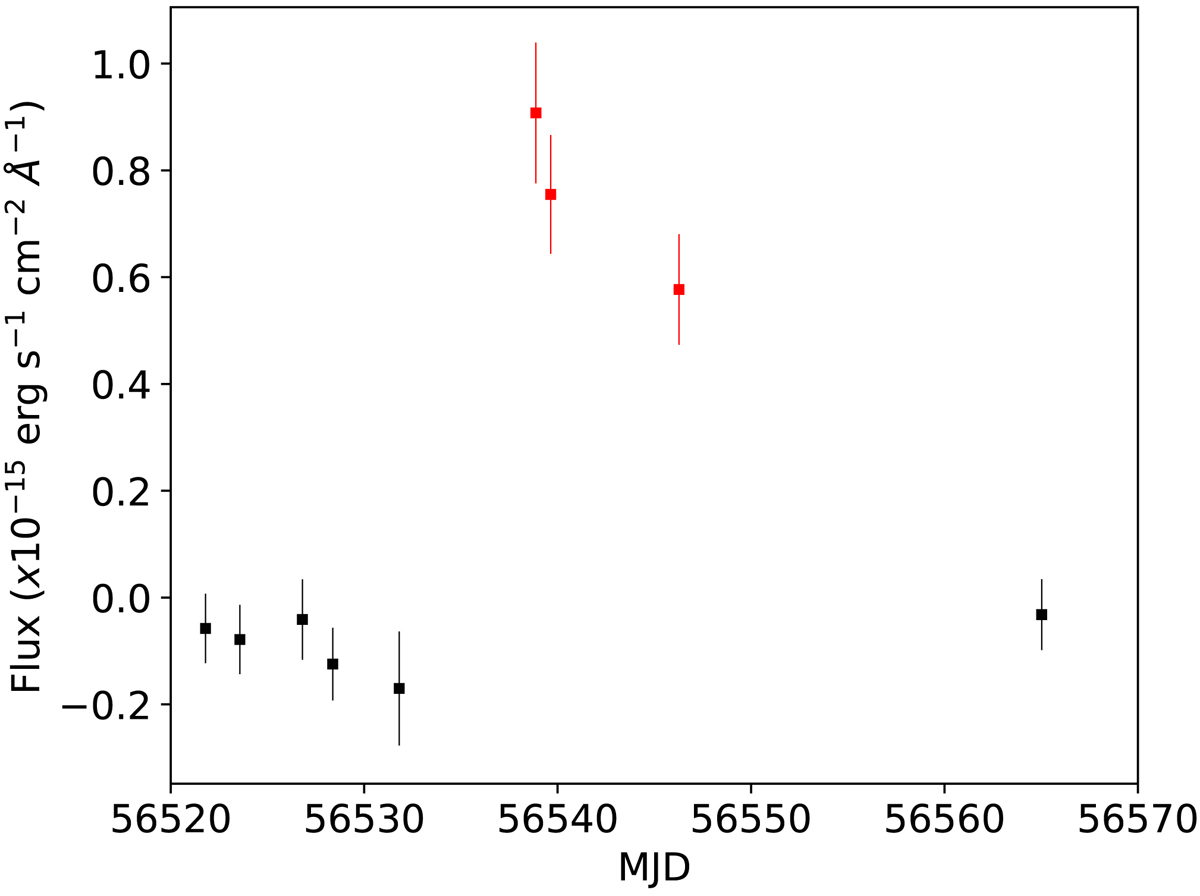
Zoom of the uvm2 light curve of SW3 during its only observed outburst in the UVOT data, showing that the outburst lasted at most 30 days and that the rise time was only a few days. Owing to the gaps in the data, the decay timescales could not be constrained to better than < 20 days. The red points show detections and the black points represent non-detections.
Current usage metrics show cumulative count of Article Views (full-text article views including HTML views, PDF and ePub downloads, according to the available data) and Abstracts Views on Vision4Press platform.
Data correspond to usage on the plateform after 2015. The current usage metrics is available 48-96 hours after online publication and is updated daily on week days.
Initial download of the metrics may take a while.