Free Access
Fig. 3.
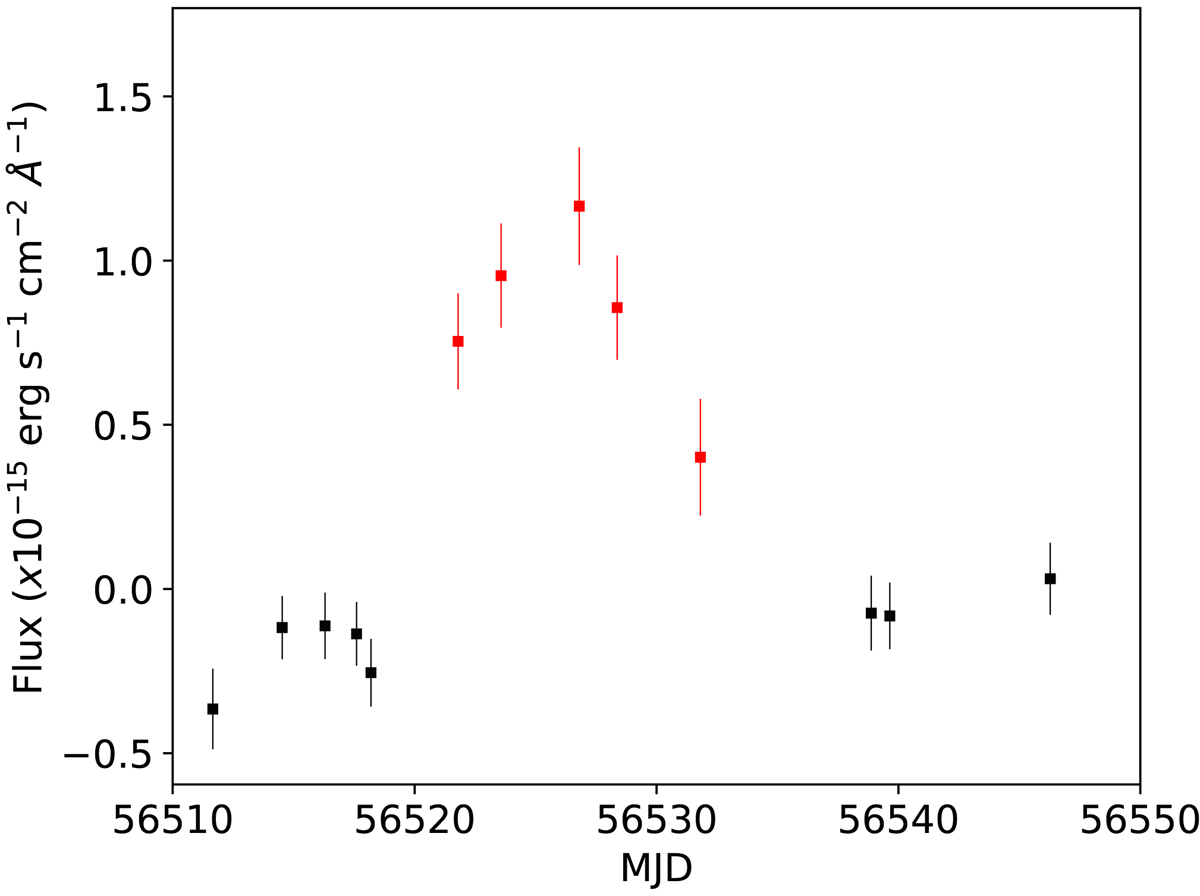
Zoom of the uvm2 light curve of SW2 during its second observed outburst in the UVOT data, showing that the source exhibited a rise and decay in brightness over a 10 day period, with a maximum duration of the outburst of 20 days. The red points show detections and the black points show non-detections.
Current usage metrics show cumulative count of Article Views (full-text article views including HTML views, PDF and ePub downloads, according to the available data) and Abstracts Views on Vision4Press platform.
Data correspond to usage on the plateform after 2015. The current usage metrics is available 48-96 hours after online publication and is updated daily on week days.
Initial download of the metrics may take a while.