Fig. 2.
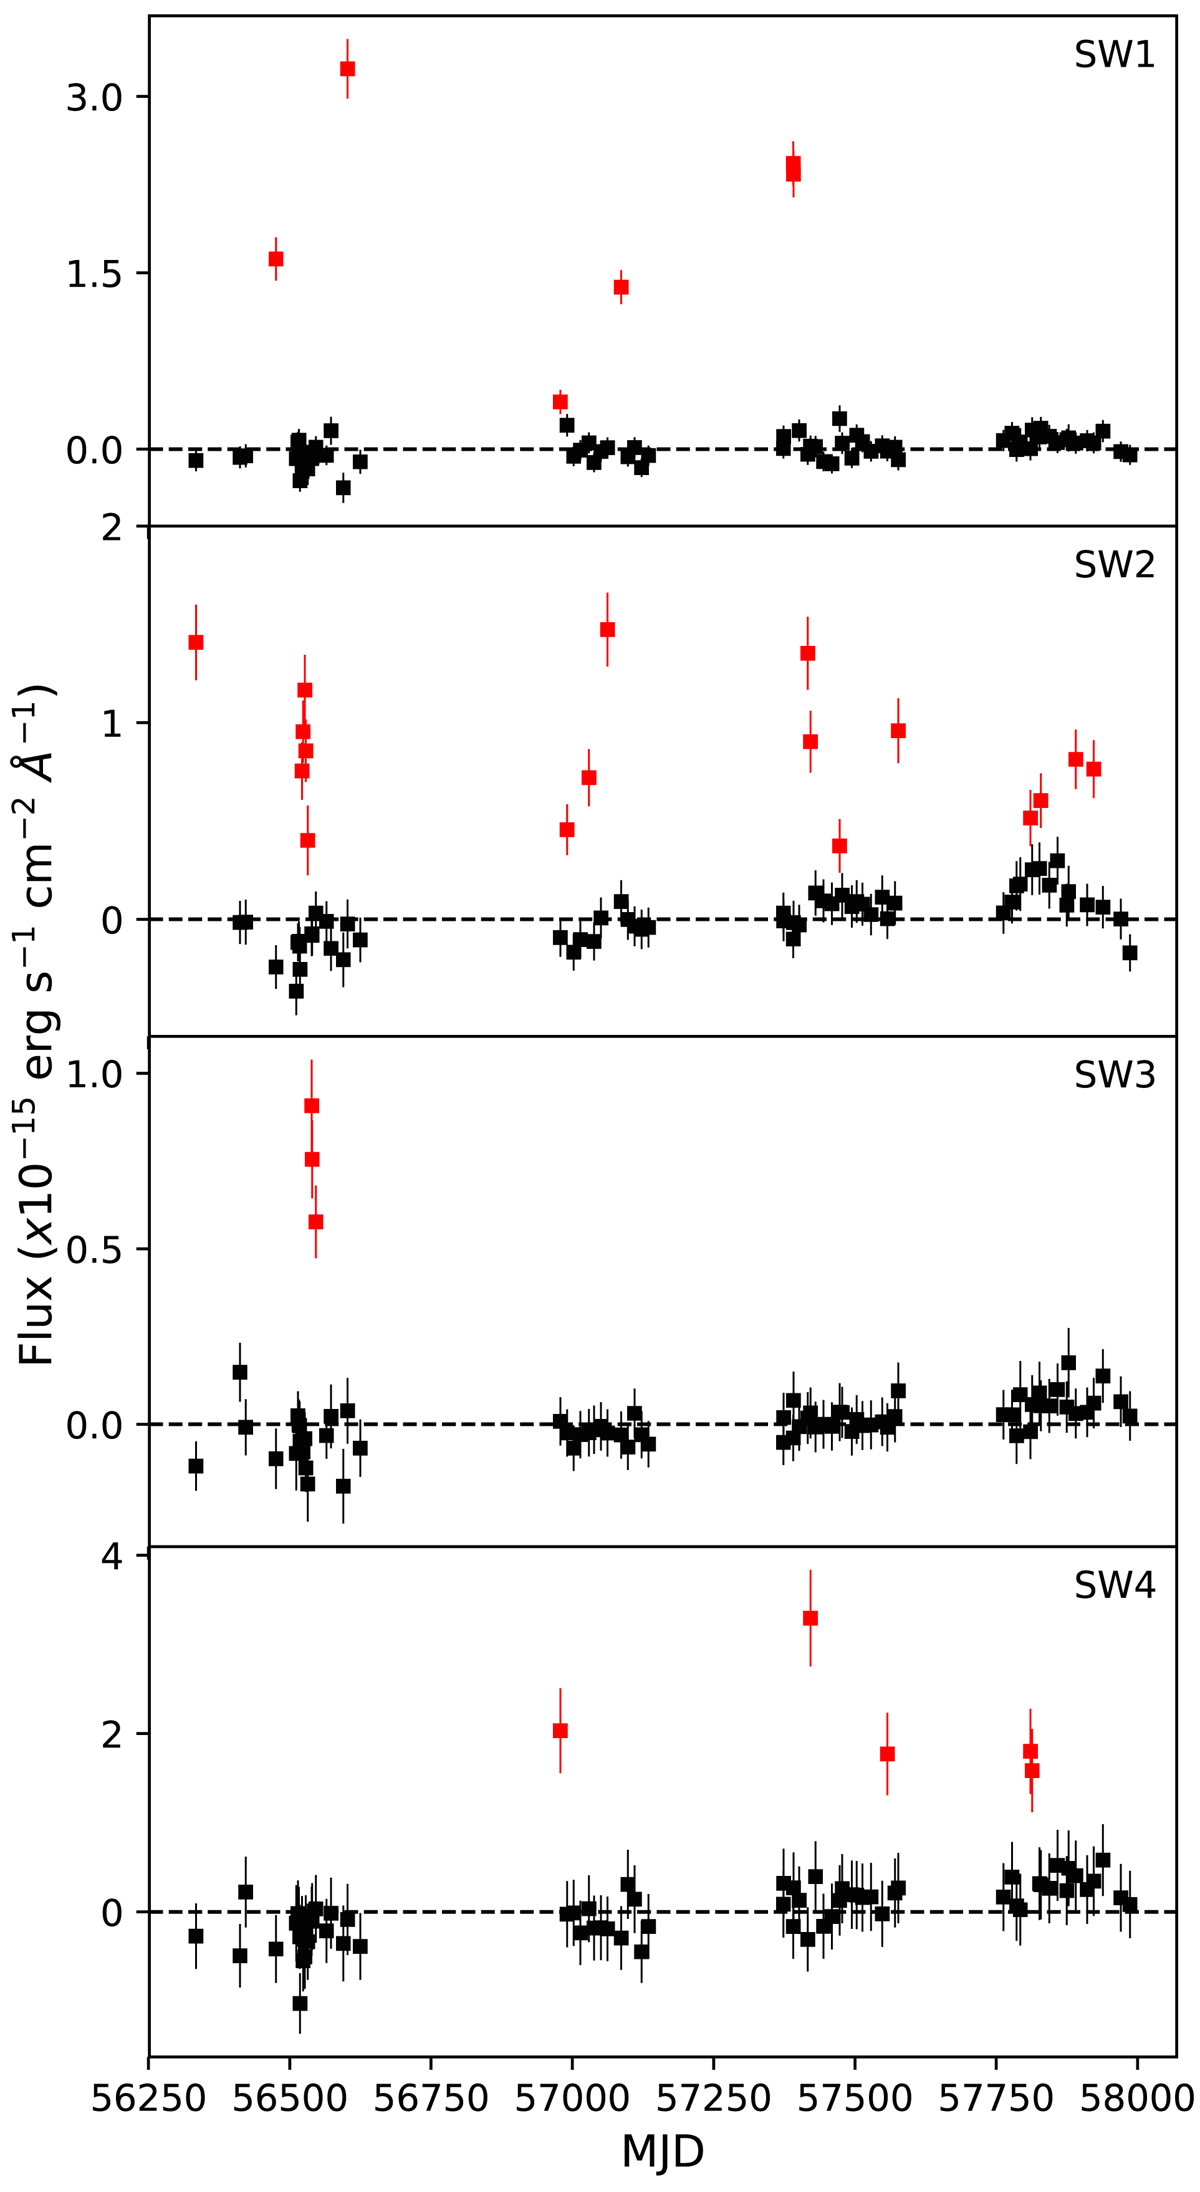
Light curves from uvm2 for all four UV transients. The red points are detections and the black points are non-detections. The errors bars are the total 1σ (statistical and systematic) errors as obtained using the uvotsource tool. All data points are corrected for cluster background by subtracting the mean cluster flux at the source position when the sources are not detected. The black dashed lines are the averages of the black points after correction (thus fixed at a flux of 0).
Current usage metrics show cumulative count of Article Views (full-text article views including HTML views, PDF and ePub downloads, according to the available data) and Abstracts Views on Vision4Press platform.
Data correspond to usage on the plateform after 2015. The current usage metrics is available 48-96 hours after online publication and is updated daily on week days.
Initial download of the metrics may take a while.