Fig. 1.
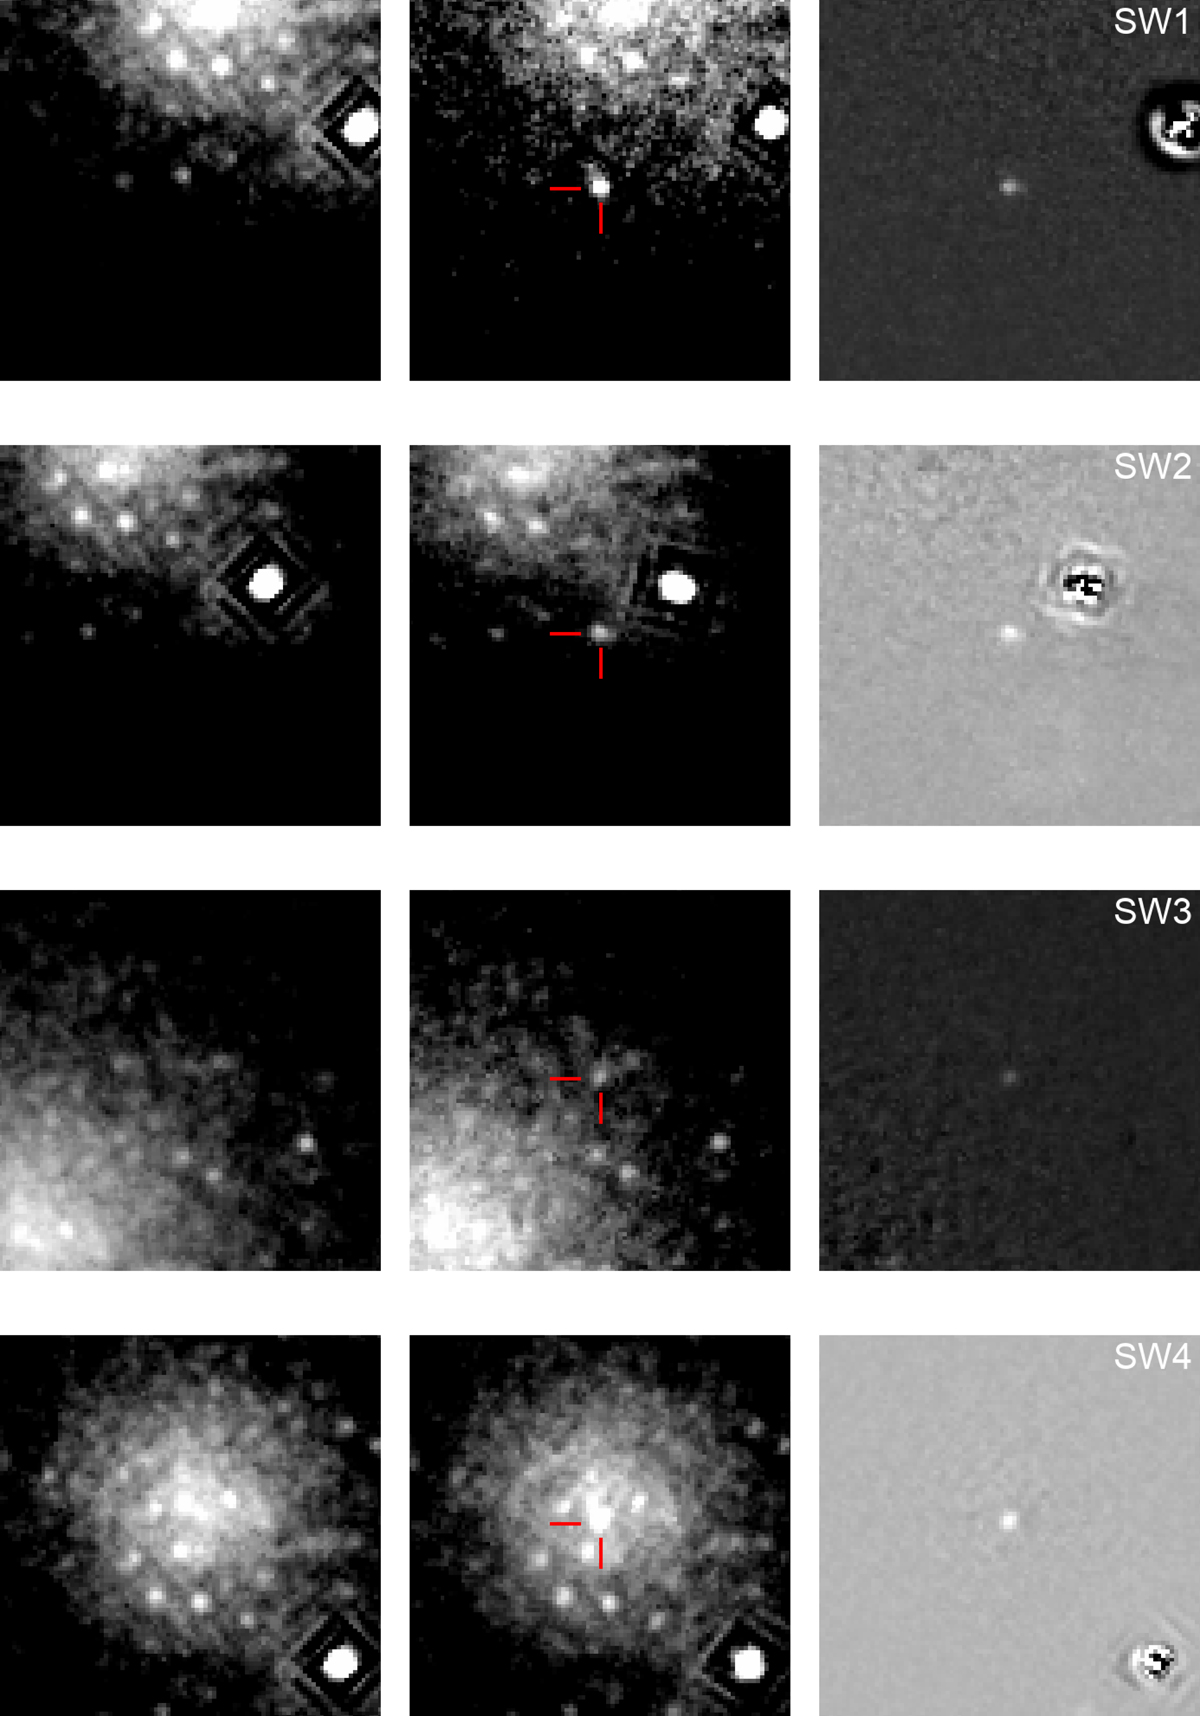
Image subtraction examples for the four transient sources identified in the UVOT data. Left: the template image; centre: sample science images in which enhanced activity of the sources was detected; right: the corresponding difference image. All images are 1.5′ × 1.5′. North is up and east is to the left. In the science images, the detected transients are indicated by red lines. The template image corresponds to (the first snapshot of) the observation with ObsID 00049754001. The science images correspond to (the first snapshot of) the observations of ObsID 00049754022, 00084119009, 00049754016, and 00084119023, respectively, for SW1–SW4.
Current usage metrics show cumulative count of Article Views (full-text article views including HTML views, PDF and ePub downloads, according to the available data) and Abstracts Views on Vision4Press platform.
Data correspond to usage on the plateform after 2015. The current usage metrics is available 48-96 hours after online publication and is updated daily on week days.
Initial download of the metrics may take a while.