Fig. 2.
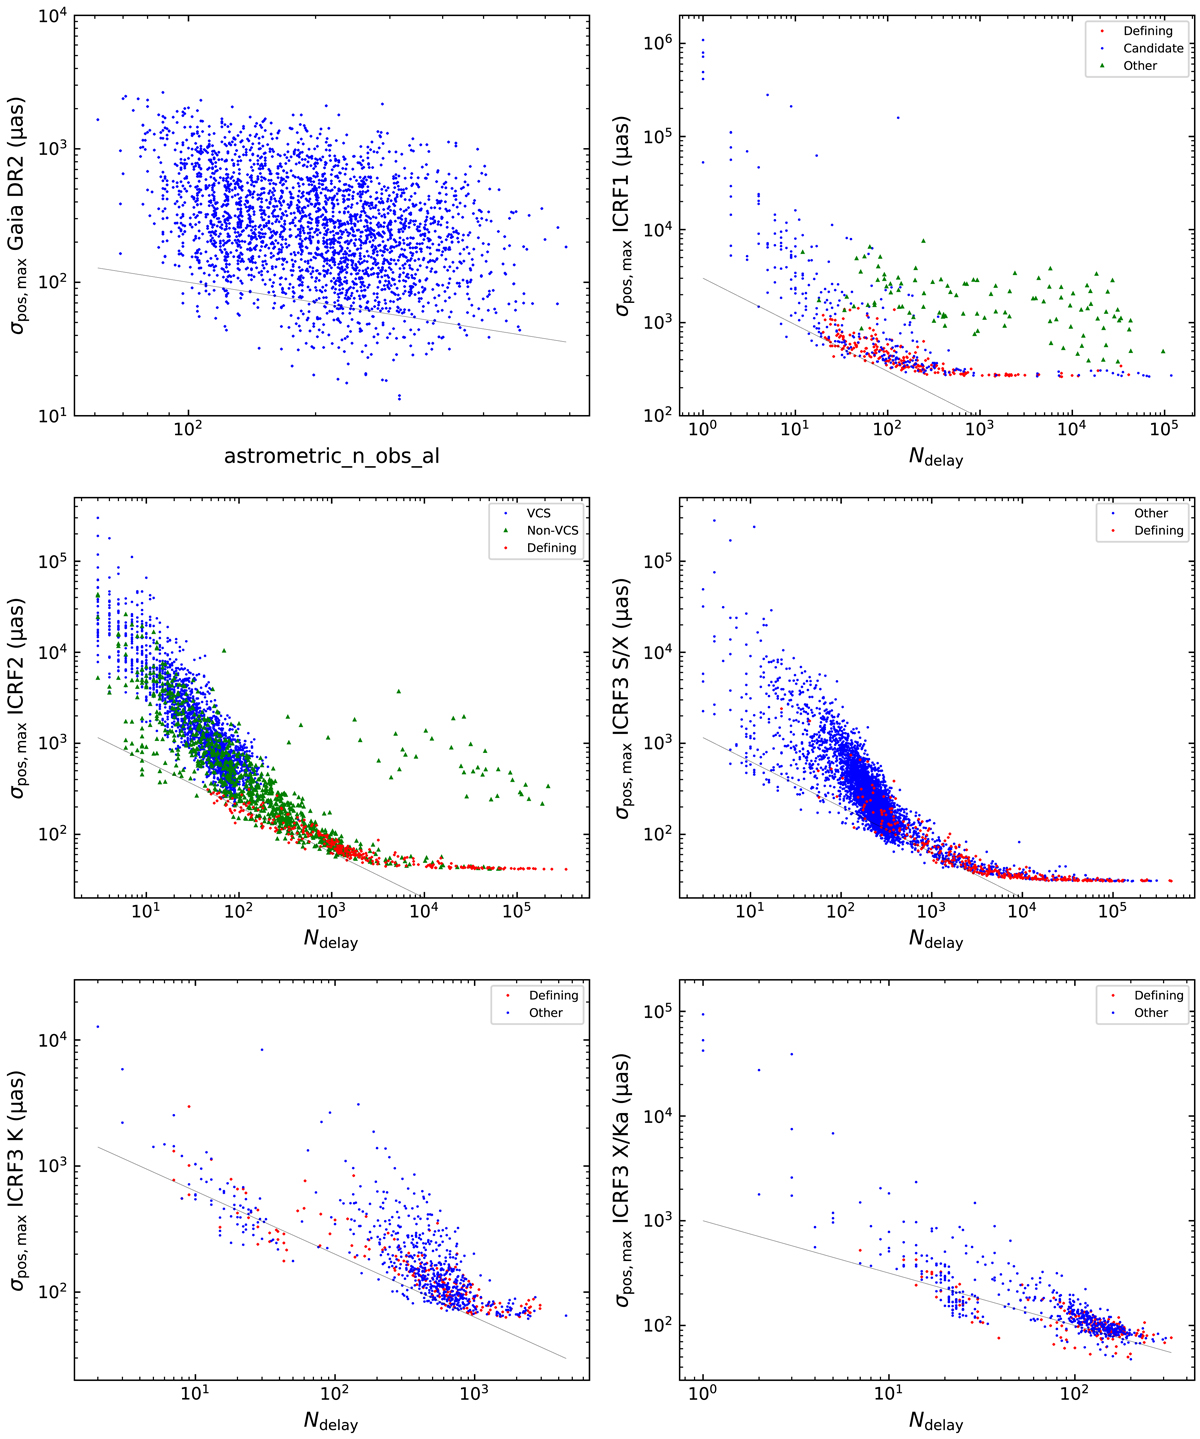
Positional errors as a function of the number of observations for 1288 ICRF sources at G < 18.7 in Gaia DR2 and all sources in ICRF catalogs. The positional error is computed as the semi-major axis of error ellipse using Eq. (1) in Gaia Collaboration (2018a). Sources in the ICRF catalogs are labeled by their category specified in each catalog. The black solid line indicates the power-slope from a Gaussian distribution. The number of observation is represented by the column astrometric_n_obs_al in the Gaia DR2 and the number of delays in the ICRF catalogs.
Current usage metrics show cumulative count of Article Views (full-text article views including HTML views, PDF and ePub downloads, according to the available data) and Abstracts Views on Vision4Press platform.
Data correspond to usage on the plateform after 2015. The current usage metrics is available 48-96 hours after online publication and is updated daily on week days.
Initial download of the metrics may take a while.