Fig. 8
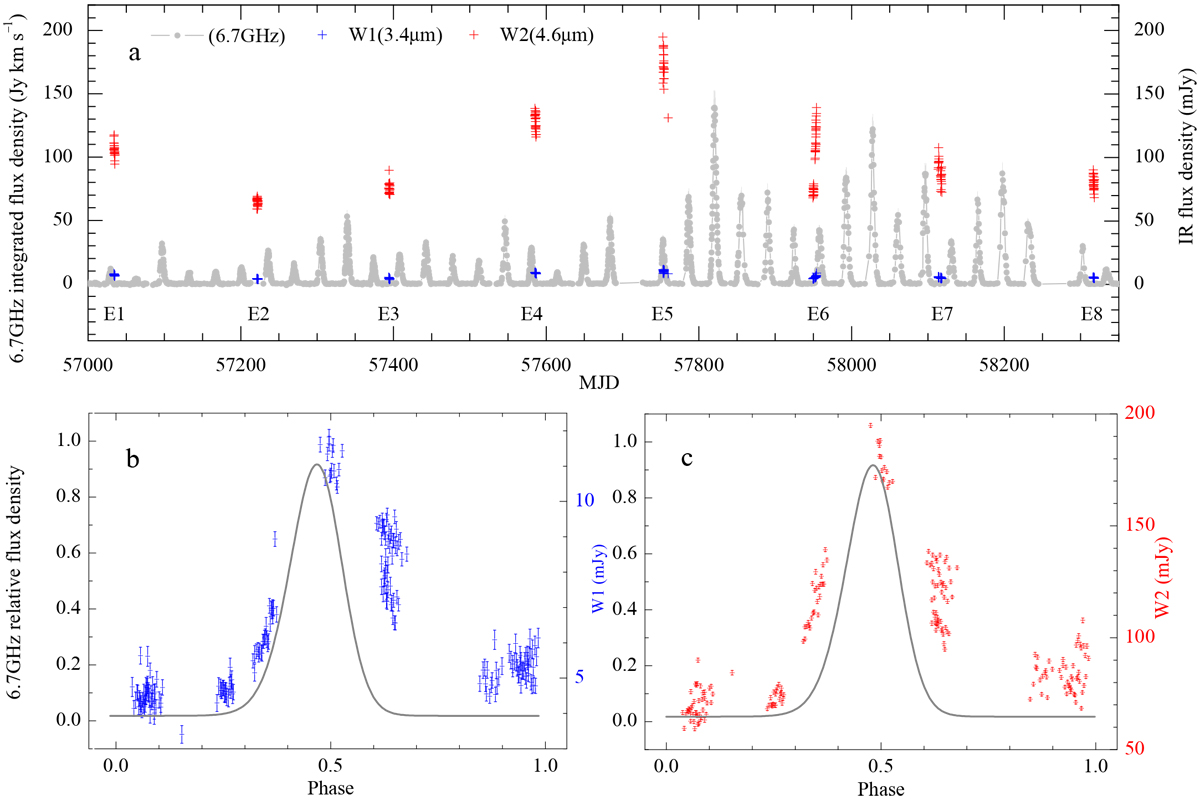
Panel a: comparison of the methanol maser time series and the NEOWISE photometric data during this period. The epochs of IR observations are numbered with E1–E8. Panels b and c: NEOWISE light curves folded by the 34.4 d period for bands W1 and W2, respectively. The grey line shows the phased and normalised methanol light curve as taken from the top panel of Fig. 2.
Current usage metrics show cumulative count of Article Views (full-text article views including HTML views, PDF and ePub downloads, according to the available data) and Abstracts Views on Vision4Press platform.
Data correspond to usage on the plateform after 2015. The current usage metrics is available 48-96 hours after online publication and is updated daily on week days.
Initial download of the metrics may take a while.