Free Access
Fig. 7
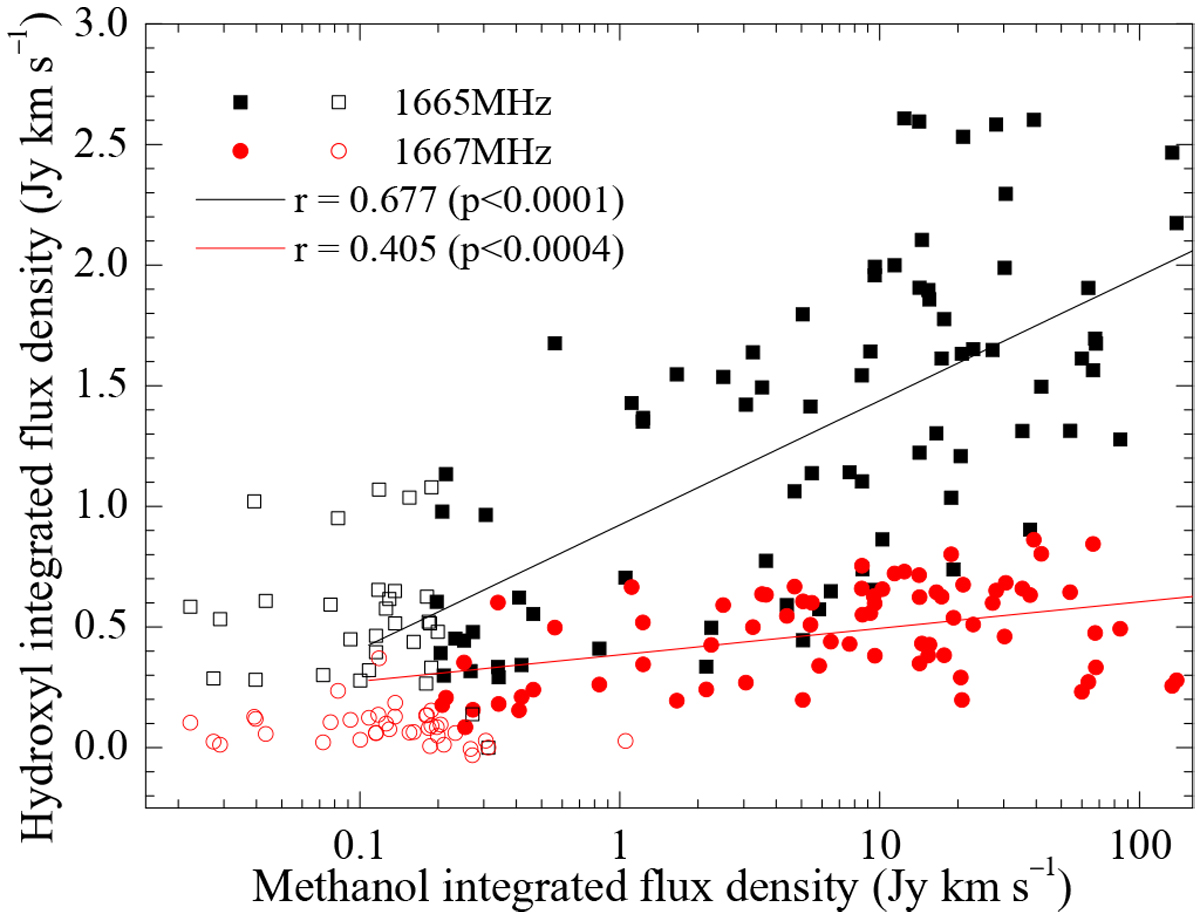
Correlation between the OH 1.665/1.667 GHz and CH3OH 6.7 GHz maser integrated flux densities. The open symbols denote the upper limits for at least one transition. The solid lines show the best fits to the data.
Current usage metrics show cumulative count of Article Views (full-text article views including HTML views, PDF and ePub downloads, according to the available data) and Abstracts Views on Vision4Press platform.
Data correspond to usage on the plateform after 2015. The current usage metrics is available 48-96 hours after online publication and is updated daily on week days.
Initial download of the metrics may take a while.