Fig. 5
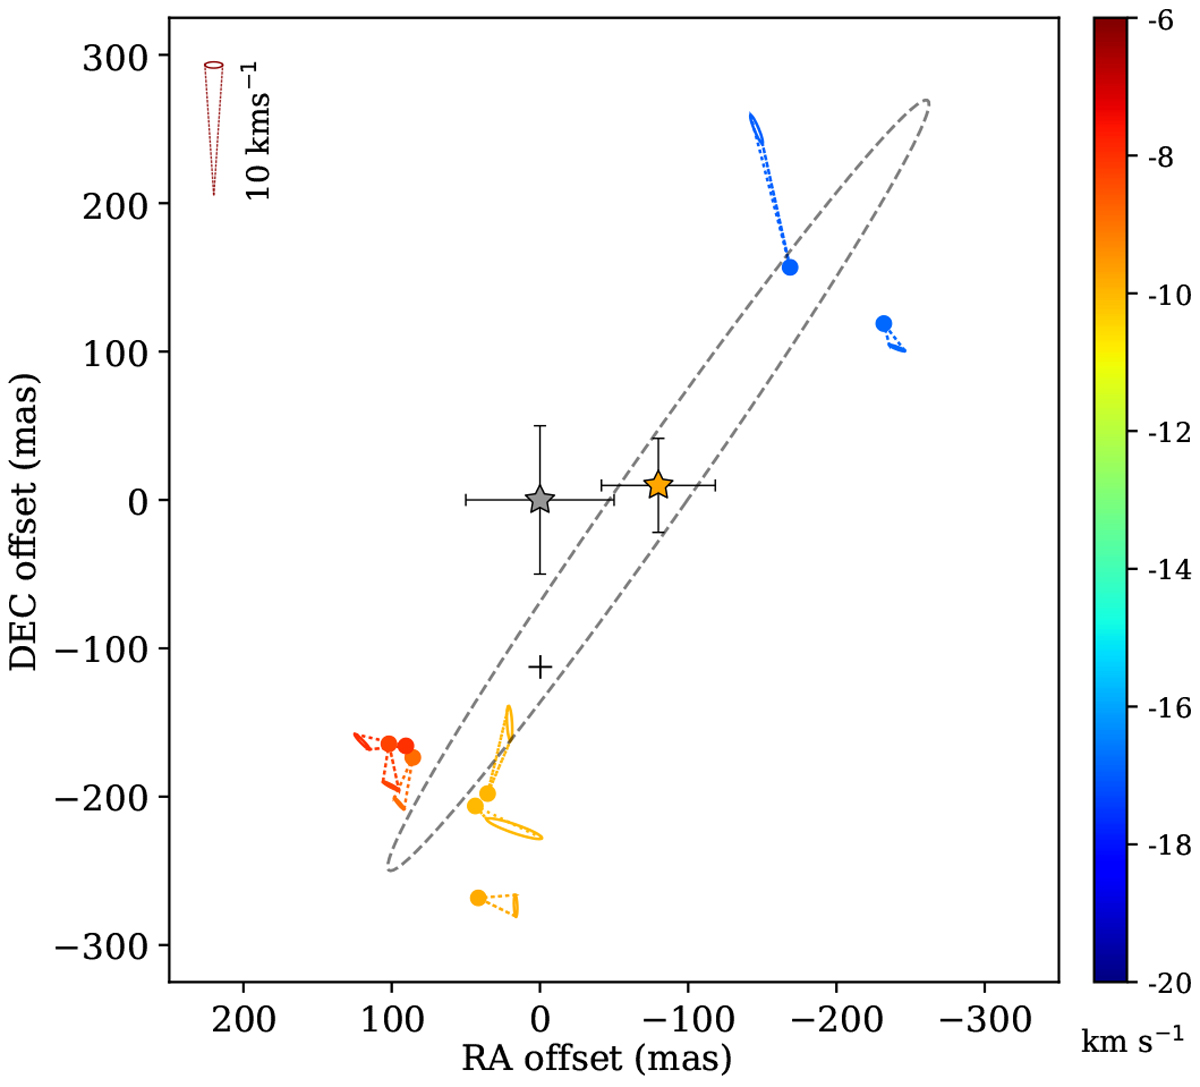
Proper motions of the methanol maser cloudlets in G107 as measured relative to their centre of motion denoted by small black cross. Cones represent the proper motions in each cloudlet listed in Table A.2 and their colours and apertures correspond to the radial velocity (colour bar) and uncertainty, respectively. The velocity scale is shown at the top right corner. The dashed ellipse displays the model of ring derived from the 3D structure analysis shown in Fig. 6, where the yellow star shows the position of fitted centre of the ring. The grey star denotes the position of the 1.3 mm continuum peak (Palau et al. 2011).
Current usage metrics show cumulative count of Article Views (full-text article views including HTML views, PDF and ePub downloads, according to the available data) and Abstracts Views on Vision4Press platform.
Data correspond to usage on the plateform after 2015. The current usage metrics is available 48-96 hours after online publication and is updated daily on week days.
Initial download of the metrics may take a while.