Fig. 4
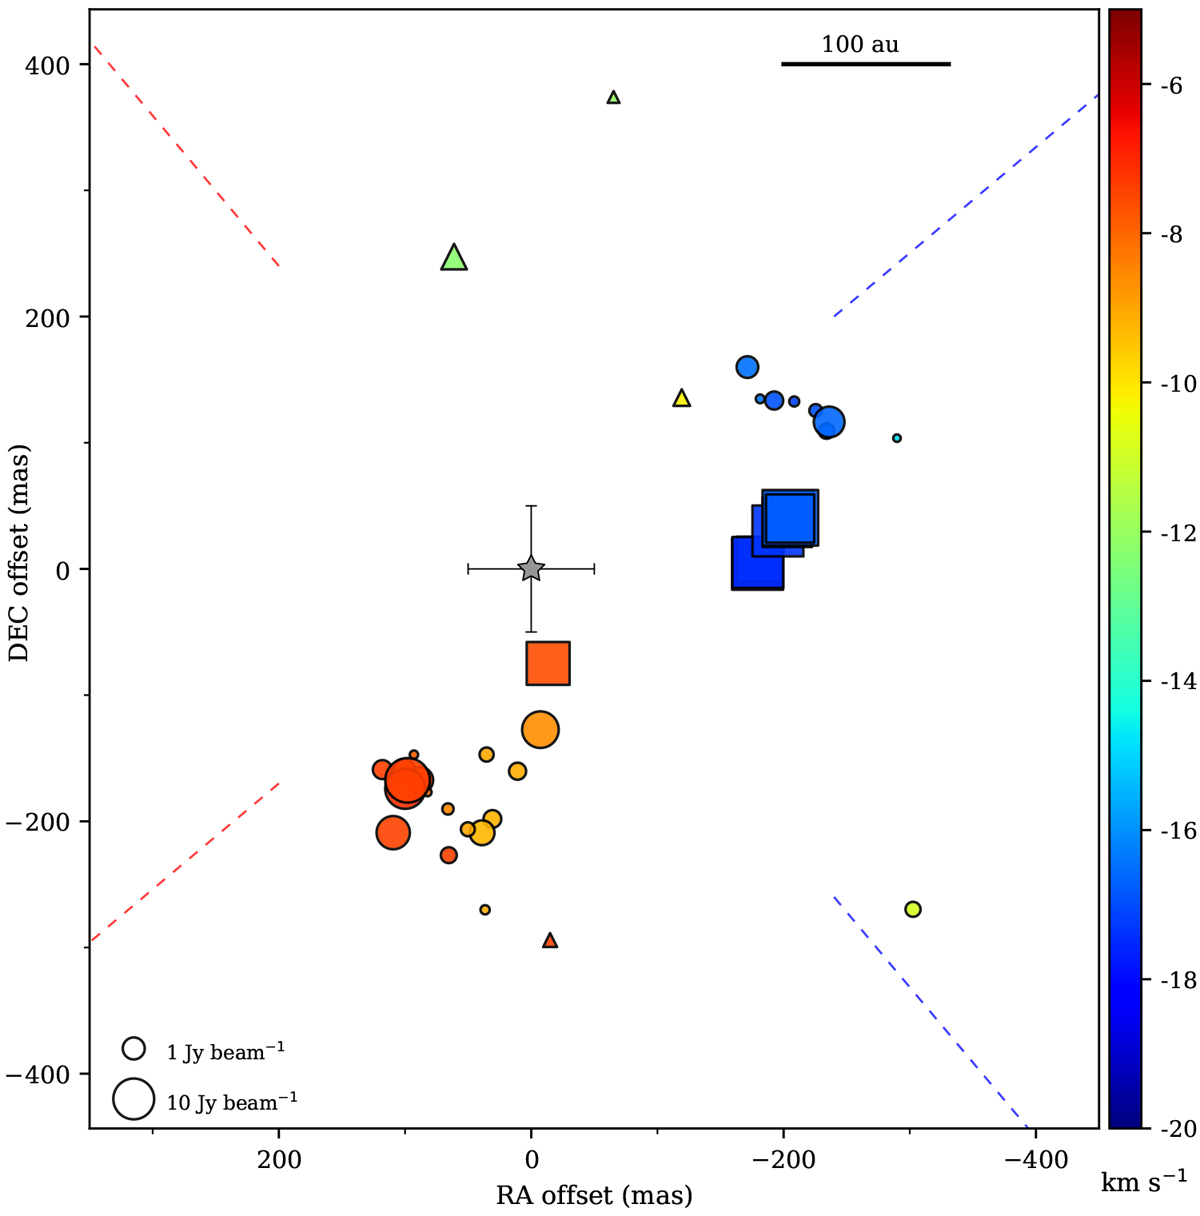
Composite map of three maser transitions in G107. The OH 1665 MHz (triangles), CH3 OH 6.7 GHz (circles), and H2O 22 GHz (squares) cloudlets are shown; the observations were carried out on MJD 58 063, 57 681 and 57 929, respectively. The symbol size is proportional to the logarithm of maser brightness of the cloudlets and its colour denotes the velocity according to the colour bar. The systematic errors in the relative position between different transitions are estimated to be less than 18 mas. The grey star symbol with the marked positional uncertainty represents the position of the 1.3 mm continuum peak at RA(J2000) = 22h21m26. s7730 and Dec(J2000) = 63°51′37.′′657 (Palau et al. 2013) likely indicating the location of IMYSO. The blue and red dashed lines denote the directions of two large-scale molecular outflows (Palau et al. 2011). The horizontal bar indicates the linear scale for the assumed distance of 0.76 kpc (Hirota et al. 2008).
Current usage metrics show cumulative count of Article Views (full-text article views including HTML views, PDF and ePub downloads, according to the available data) and Abstracts Views on Vision4Press platform.
Data correspond to usage on the plateform after 2015. The current usage metrics is available 48-96 hours after online publication and is updated daily on week days.
Initial download of the metrics may take a while.